Mental health problems among Estonia’s adult population
Mental health disorders, or mental disorders, may disrupt self-control and coping skills, as well as a person’s capacity for self-realisation, interaction with others, building relationships and contributing to society. Mental health disorders are complex problems arising from the interaction of genetic and environmental factors as well as individual behaviour. Every year, an estimated one in five people worldwide experiences some form of mental health problem, while one in three experiences mental problems sometime during their life (Steel et al. 2014). Individual mental health disorders have a significant economic impact on society as a whole. In Europe, the average total cost of mental disorders is estimated at over 4.1% of the gross domestic produc (OECD 2018). This figure includes direct health care costs (1.3%), the cost of social protection programmes (1.2%) and indirect costs, such as those related to unemployment and lower productivity rates resulting from the disorders (1.6%).
According to Ferrari et al. (2022) , the global prevalence rate of any of the more common mental disorders did not change significantly between 1990 and 2019. Depression, anxiety and eating disorders are more prevalent among women, while attention deficit and hyperactivity and autism spectrum disorders are more common among men. Compared to most other parts of the world, Europe has very high rates of anxiety disorders and attention deficit hyperactivity disorder. These increased by approximately 5% between 1990 and 2019. However, Europe is not more depressed than the rest of the world, and depression rates in Europe decreased slightly from 1990 to 2019.
There is evidence that the rate of mental health disorders has increased worldwide during the COVID-19 pandemic, including an estimated increase of more than 25% in cases of depression or anxiety disorder (Santomauro et al. 2021). It is worth noting that these estimates are primarily based on data from wealthy countries and have been interpolated from self-report surveys. The long-term effects of the COVID-19 pandemic on mental health are still unclear.
The prevalence of mental disorders varies widely across studies. The main methods for determining prevalence are (a) the use of registry data, (b) population-based surveys and (c) clinical interviews. Depending on the method used, studies can either overestimate or underestimate the prevalence of mental disorders. The prevalence rate of depression, for example, can vary by several times depending on the assessment method(Sjöberg et al. 2017) While registry data can underestimate the prevalence of disorders, self-report surveys tend to overestimate it.
Symptoms of depression and generalised anxiety disorder according to the International Classification of Diseases (ICD-10) and the Emotional State Questionnaire (EST-Q-2)
| ICD-10 | EST-Q-2 | |
| Assessment | Medical assessment of the symptoms based on a clinical interview and other methods, with cases reflected in the registry data. | Self-report questionnaire about the frequency of experiencing the following problems during the past month. Answer options: ‘not at all’, ‘rarely’, ‘sometimes’, ‘often’, ‘constantly’. |
| DEPRESSION | Main symptoms: lowered mood, loss of interest and zest for life, and decreased energy, which contributes to increased weariness and decreased activity. Additional symptoms: decreased attention and concentration, lowered self-esteem, feelings of guilt and worthlessness, pessimistic outlook on the future, thoughts or actions of self-harm or suicide, disturbed sleep, and decreased appetite. |
Sadness, loss of interest, feelings of inferiority, self-blame, repeated thoughts of death or suicide, feeling lonely, hopelessness about the future, and inability to feel joy. |
| GENERALISED ANXIETY DISORDER | The main indicator is generalised and persistent anxiety unrelated to specific environmental conditions. Frequent complaints include persistent nervousness, tremors, muscle tension, sweating, dizziness, weakness, worrying and negative anticipation. |
Irritability or anger, anxiety or fear, tension and inability to relax, excessive worrying, restlessness or impatience, fidgeting, and being easily startled. |
This article focuses on three questions. First, what is the prevalence of the most common mental health problems (depression, anxiety disorders, mental exhaustion, sleep disorders and alcohol abuse) based on survey data, and how has it changed during the COVID-19 crisis? Second, what does registry data tell us about the prevalence of mental health disorders? Third, to what extent do genetic and environmental factors contribute to the occurrence of mental health disorders? Our approach to these questions will rely on data from the Estonian National Mental Health Study, the 2019 Estonian Health Interview Survey, the Estonian Genome Centre of the University of Tartu and the Estonian Health Insurance Fund.
Survey data show that mental health disorders are widespread
We used self-reported data collected for the Estonian National Mental Health Study in the first half of 2021 to estimate the prevalence of depression, anxiety disorders, sleep disorders, mental exhaustion and alcohol abuse (and resulting mental disorders). Depression, anxiety and sleep disorders were assessed using the EST-Q-2 Emotional State Questionnaire (Aluoja et al. 1999) and alcohol abuse was assessed using the AUDIT-C screening test (Bush, Kivlahan, McDonell et al. 1998).
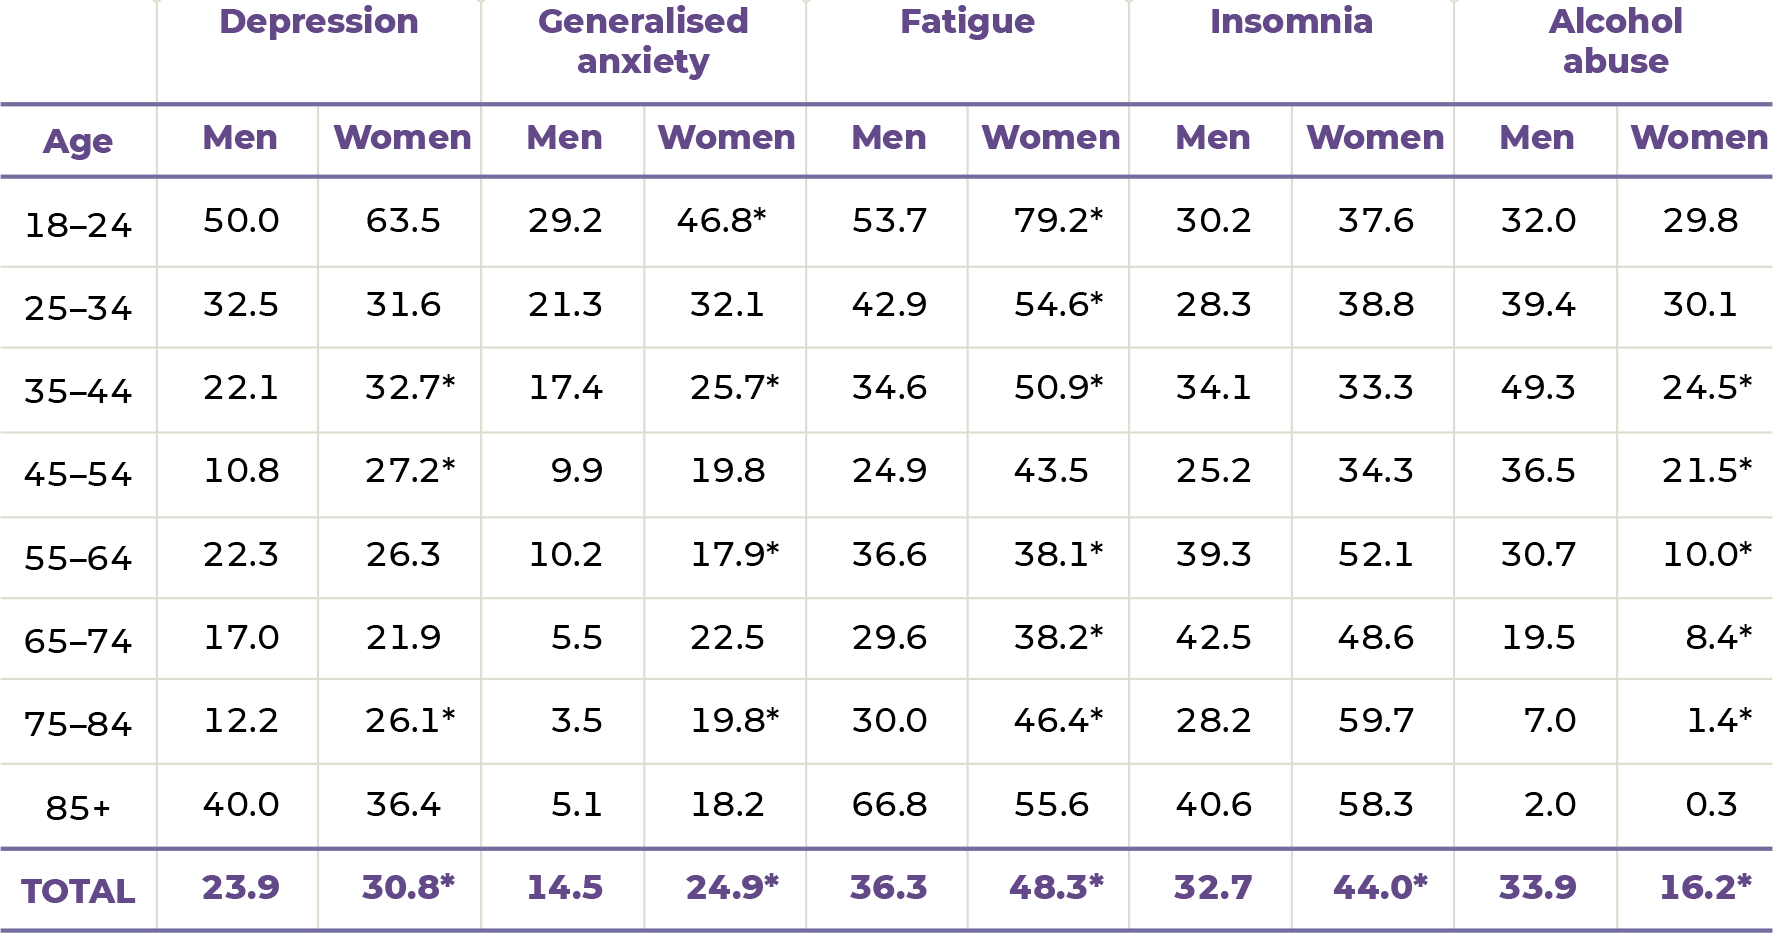
The results of the study indicate a high prevalence of mental health disorders in the adult population. About a fourth of the respondents (28%) were at risk for depression (24% of men and 31% of women), and a fifth (20%) were at risk for anxiety disorder (15% of men and 25% of women). The risk of sleep disorders was found in 39% of the respondents (33% of men and 44% of women). Signs of mental exhaustion were seen in 43% of the respondents (36% of men and 48% of women).
A closer look at the data by gender and age group (Table 1.4.1), reveals that the group most at risk of experiencing these disorders were young adults (18-to-24-year-olds). Similar to previous research, the study found that in all age groups, women had a higher risk of depression and anxiety disorders than men. While there were no statistically significant gender differences in the risk of sleep disorders, the risk was shown to increase with age.
Alcohol abuse was indicated in 17% of women and 34% of men. However, there were no gender differences in the prevalence of alcohol abuse in the younger age groups (18–34) (Table 1.4.1). From the age of 35, alcohol abuse was significantly more frequent among men, affecting as much as 49% of male respondents aged 35 to 44.
The prevalence of mental health disorders increased during the COVID-19 pandemic
The COVID-19 pandemic led to a significant increase in mental health problems,
in all EU member states (WHO 2022). According to data from the first wave of the Estonian National Mental Health Study, 15% of men and 20% of women felt that their mental health had significantly deteriorated during the COVID-19 crisis. The share of people with deteriorated mental health was significantly higher among younger people. For example, 28% of men aged 18–29 felt that their mental health had deteriorated, while the same was true for only 7% of middle-aged men (45–59) and 10% of older men (60–85+). Forty percent of women aged 18–29 rated their mental health as worse than before the pandemic, while only 18% of middle-aged women and 12% of older women felt this way.
Comparing depression, anxiety disorder and mental exhaustion indicators in the Estonian National Mental Health Study data and the Estonian Health Interview Survey data collected in 2019 shows similar results for the prevalence of mental health disorders during the pandemic. The results indicate that during the pandemic, the risk of depression and generalised anxiety disorder, as well as signs of mental exhaustion, increased significantly among people aged 18 to 44 (Figure 1.4.1). Mental health problems were most common among 18-to-24-year-olds even before the pandemic. During the pandemic, the share of young people at risk of depression further increased. In older people, on the other hand, self-reports indicated no differences in the risk of depression between the time before and during the pandemic.
J1.4.1.R
maiko.koort
2023-06-20
library(ggplot2)

#faili sisselugemine
J141=read.csv("PT1-T1.4-J1.4.1.csv",header=TRUE, encoding ="UTF-8")

#joonis
ggplot(J141,aes(x=Age,y=Keskmine*100,col=Uuring))+
  facet_grid(~DV)+
  geom_point(pos=position_dodge(0.5),cex=3)+
  geom_errorbar(aes(x=Age,ymin=Alumine*100,ymax=Ylemine*100),width=0.2,linewidth=0.9,pos=position_dodge(0.5))+
  geom_line(aes(group=Uuring),pos=position_dodge(0.5))+
  scale_color_manual(values=c("#FF3600","#1E272E"),labels = c("2019","2021"))+
  theme_minimal()+
  theme(text = element_text(color="#668080"),axis.text=element_text(color="#668080"))+
  theme(strip.text.x = element_text(color = "#668080"))+ #Facet_grid pealkirjade värv (Mehed ja naised)
  theme(axis.text.x = element_text(angle = 45))+
  theme(legend.title=element_blank())+
  scale_y_continuous(breaks=seq(0,70,by=10))+
  ylab("%")
The prevalence of mental health disorders is significantly lower according to treatment cases in registry data
Due to Estonia’s high rate of coverage (about 95% of the population has medical insurance), registry data from the Estonian Health Insurance Fund treatment bills database provide a good overview of the number of diagnosed mental disorders in the population. The following describes the prevalence of all mental disorders (ICD-10 sections F00–F99) among the Estonian population aged 15 and older, with a special focus on anxiety disorders (F40–F41), depression (F32–F33), alcohol-related mental and behavioural disorders (F10) and sleep disorders (F51). This is done using data on treatment bills for 2016–2020 from the Health Insurance Fund database. The rates presented here as prevalence (and their 95% confidence intervals) have been found based on the number of people with a corresponding treatment bill and the average population of the year by gender and five-year age groups.
On average, almost 142,000 people per year had a mental disorder cited as either the primary or concomitant diagnosis on their treatment bill. From 2016 to 2020, the number of cases of treating mental disorders increased by an average of 1% per year (from 139,470 in 2016 to 144,738 in 2020). The number of cases of treating diagnosed mental disorders did not decrease in 2020, despite the partial suspension of planned treatment in response to the COVID-19 pandemic.
Patients being treated for mental disorders are more likely to be women than men. In 2020, women made up 57% of all medically insured persons aged 15 and over. Meanwhile, they accounted for 63% of the people treated for mental disorders. Gender differences in the distribution of mental health treatment cases also stand out in the comparison of age groups (Figure 1.4.2), where the prevalence of mental disorders among women is higher by almost a fifth than among men in people aged 15–34 and by almost a fourth in people aged 35 and older. Between 2016 and 2020, an average of 10% of men and 15% of women had treatment bills that included a diagnosis of a mental disorder. The prevalence of registered cases of mental disorders increased with age in both men and women, with the highest rates in the oldest age group.
J1.4.2.R
maiko.koort
2023-06-20
library(tidyr)
library(ggplot2)
library(dplyr)
##
## Attaching package: 'dplyr'## The following objects are masked from 'package:stats':
##
## filter, lag## The following objects are masked from 'package:base':
##
## intersect, setdiff, setequal, unionlibrary(scales)
#faili sisselugemine ja andmete formaadi korrigeerimine
J142=read.csv("PT1-T1.4-J1.4.2.csv",header=TRUE, encoding ="UTF-8")
J142=pivot_longer(J142,2:19)
J142$name=sub('X',"",J142$name)
J142$name=sub('\\.',"-",J142$name)
J142$name[J142$name=="-.85"]="85+"
J142=filter(J142,!name%in%c("0-4","5-9","10-14"))
errorbars=J142[91:150,]
J142=filter(J142,X%in%c("Men","Women"))
J142$Upper=numeric(30)
J142$Lower=numeric(30)
J142$Upper[1:15]=errorbars$value[1:15]
J142$Lower[1:15]=errorbars$value[16:30]
J142$Upper[16:30]=errorbars$value[31:45]
J142$Lower[16:30]=errorbars$value[46:60]
ggplot(J142)+
geom_col(aes(x=name,y=value,fill=X),pos=position_dodge(0.7),width=0.8)+
geom_errorbar(aes(x=name,y=value,ymin=Lower, ymax=Upper,col=X),pos=position_dodge(0.7),width=0.3,show.legend = FALSE)+
theme_minimal()+
ylab("%")+
xlab("")+
scale_fill_manual(values=c("#1E272E","#FF3600"))+
scale_color_manual(values=c("#FF3600","#1E272E"))+
theme(text = element_text(color="#668080"),axis.text=element_text(color="#668080"))+
theme(legend.title=element_blank())
Figure 1.4.3 shows the average prevalence of anxiety disorders, depression, sleep disorders, and mental and behavioural disorders resulting from alcohol abuse for the period 2016–2020. Every year, an average of 36,000 people had treatment bills with a diagnosis for anxiety disorders. Over five years, the number of treatment cases increased by almost a fourth (32,344 in 2016 v. 39,500 in 2020), or an average of 5% per year. Between 2016 and 2020, the average prevalence of anxiety disorders or phobias among 15-year-olds and older was 2% for men and 4% for women. In men, the prevalence rate was highest among 20-to-24-year-olds (3%), while in women, it rose above 4% from the age of 35.
Every year, an average of 41,400 people, or 4% of the Estonian population, had treatment bills with a diagnosis for depression. As with anxiety disorders, women were more than twice as likely as men to be diagnosed with depression (5% v. 2%). Going by age group, the prevalence was highest among 50-to-59-year-olds (6–7% in women and 2–3% in men).
An average of 10,200 people a year had treatment bills that featured a diagnosis of mental and behavioural disorders resulting from alcohol abuse, with 78% of these cases involving men. Thus the rate of mental disorders resulting from alcohol abuse was significantly higher in men (1.6%) than in women (0.4%), with the highest rates in men aged 50 to 59 (2.3–2.8%). In women, the prevalence of these disorders remained below 1% in all age groups. It is, however, important to consider that the number of diagnosed cases of mental disorders resulting from alcohol abuse does not reflect the actual prevalence of problematic alcohol use in society.
An average of 15,700 people per year had treatment bills with a sleep disorder diagnosis, and two-thirds of these bills were for women. The prevalence of sleep disorders was 1.7% in women and 1.0% in men. In both men and women, the prevalence increased with age, with the highest rates found among people aged 85 and older.
J1.4.3.R
maiko.koort
2023-06-20
library(tidyr)
library(ggplot2)

#faili sisselugemine ja andmete formaadi korrigeerimine
J143=read.csv2("PT1-T1.4-J1.4.3.csv",header=TRUE, encoding ="UTF-8")
J143x=J143[4:6,]
J143=J143[1:3,]
J143=pivot_longer(J143,2:5)
J143x=pivot_longer(J143x,2:5)
J143$value=as.numeric(J143$value)
J143$dif=as.numeric(J143x$value)

J143$name[J143$name=="Anxiety disorders..F40.F41."]="Ärevushäired (F40-F41)"
J143$name[J143$name=="Depression..F32.F33."]="Depressioon (F32-F33)"
J143$name[J143$name=="Alcohol addiction..F10."]="Alkoholisõltuvus (F10)"
J143$name[J143$name=="Sleep disorders..F51."]="Unehäired (F51)"

J143$X=as.factor(J143$X)
J143$X=factor(J143$X,levels=c("Total","Women","Men"))

J143$name=as.factor(J143$name)
J143$name=factor(J143$name,levels=levels(J143$name)[c(4,1,3,2)])

# joonis
ggplot(J143)+
  geom_col(aes(x=name,y=value,fill=X),pos=position_dodge(0.6),width=0.5)+
  geom_errorbar(aes(x=name,ymin=value-dif,ymax=value+dif,col=X),pos=position_dodge(0.6),width=0.2,linewidth=0.8,show.legend = FALSE)+
  theme_minimal()+
  theme(legend.title=element_blank())+
  coord_flip()+
  ylab("%")+
  xlab("")+
  scale_fill_manual(values=c("#1E272E","#FF3600","#668080"),breaks=c("Men","Women","Total"))+
  scale_color_manual(values=c("#1E272E","#1E272E","#FF3600"))+
  theme(text = element_text(color="#668080"),axis.text=element_text(color="#668080"))
Genetic and environmental determinants of mental health
Genes and environment both play a role in the development of mental health problems. The reasons for the manifestation of mental health problems include both hereditary or genetic factors and environmental factors (e.g. stress, childhood experiences, socioeconomic status, lack of social support). For decades, researchers in twin and family studies have sought to determine how much either of these factors contributes to the variability in the occurrence of a given disorder. These studies rely on the premise that identical twins share 100% of their genetic material, while fraternal twins and ordinary siblings share about 50% of their genetic material. Thus, by comparing identical and fraternal twins, it is possible to calculate mathematically how much both genetic and environmental factors contribute to the manifestation of a disorder.
Today, it is known that both genetic and environmental factors play a role in the manifestation of various mental health problems, but the balance between the two is different for each problem. For example, genetic factors explain approximately 30–50% of the variability in depression (Kendall et al. 2021), while explaining 80% of the variability in schizophrenia (Legge et al. 2021). The remaining part is made up of both environmental factors and measurement errors.
Depression has a genetic predisposition
Taking the example of depression as the most frequently diagnosed mental health disorder, we used data from the Estonian Biobank to illustrate the relationship between genetic predisposition to depression and a diagnosis of depression. The Estonian Biobank’s database contains information on over 200,000 Estonian adults, including their genetic data, their health data from national databases and their answers to the biobank participant questionnaires. Genetic predisposition to depression is determined through an individual genetic risk score, which is essentially the weighted sum of all the gene variants that have been linked with depression (Howard et al. 2019). To make the results easier to interpret, we divided the genetic risk score for depression into 10 deciles, the first of which includes the 10% of people with the lowest genetic predisposition to depression, and the last of which includes the 10% of people with the highest predisposition. In the analysis, we used data from treatment bills from the Estonian Health Insurance Fund’s database that featured a diagnosis of depression (RHK-10 codes F32 and F33) in the last five years (2016–2020). Analysis of data from the Estonian Biobank reveals that during this period, depression occurred in 8% of the people with the lowest genetic predisposition and in 16% of the people with the highest genetic predisposition.
Next, we investigated how the combination of genetic predisposition and demographic, health and lifestyle factors predicted the occurrence of a depression diagnosis in the same period (2016–2020) and, by comparison, the risk of depression during the COVID spring of 2021 (joonis 1.4.4). Lifestyle data is based on a self-report questionnaire completed by biobank participants upon signing up for the Estonian Genome Project before the start of the pandemic (between January 2017 and February 2020). The risk of depression was assessed from March to July 2021 by using the Emotional State Questionnaire EST-Q-2 (Aluoja et al. 1999) and the majority of respondents completed the questionnaire during the period of strict restrictions during the second wave of COVID-19.
In the analysis, we used two logistic regression models: one to predict the diagnosis of depression in the last five years and another to predict a high risk of depression during the pandemic. In order to compare the strength of associations between different risk and protective factors, we included all demographic, health and lifestyle factors and genetic risks in the models simultaneously.
Figure 1.4.4[a] shows that the factors most strongly associated with being diagnosed with depression are female gender and a higher genetic predisposition. Females were 2.5 times as likely as males to be diagnosed with depression. High and moderate genetic predisposition increased the odds of being diagnosed with depression by 2.7 and 1.6 times, respectively, compared to those with low genetic risk. While the odds of being diagnosed with depression were highest among people aged 45–74 and were significantly higher among older people, there were no statistically significant differences between other age groups. We also see that people diagnosed with depression were more likely to have a lower level of education, have a concomitant somatic disease, be obese and have a less healthy lifestyle, move less, and smoke and drink more.
Although alcohol abuse was strongly associated with being diagnosed with depression (1.4 times the odds of being diagnosed), those who rarely or never drink alcohol were also 1.3–1.4 times as likely to be diagnosed with depression as moderate drinkers were. This association can be due to a variety of reasons; the reasons for abstaining from alcohol may, in turn, be related to depression (e.g. health considerations or the use of certain medications). Drug use increased the odds of diagnosed depression by 1.8 times.
Figure 1.4.4.b illustrates the associations of these factors with a high risk of depression during the pandemic. All in all, the associations were very similar to the pre-pandemic period, with a high depression risk most strongly associated with female gender, obesity, unhealthy lifestyle and a high genetic risk. However, there were also differences. The biggest difference was between age groups; young adults were at the greatest risk of depression during the pandemic. Although since the beginning of the pandemic, older people have been considered at risk for mental health problems due to loneliness caused by isolation and a higher risk of developing severe forms of COVID-19, young adults are 3.5 times as likely to experience depression as older people. This association probably reflects the stronger impact of coronavirus restrictions on the everyday life of young adults, with many changes to the areas of work and school (home office, online learning), as well as the social sphere (fewer opportunities for social interaction and entertainment).
Another difference was found in the amount of sleep. While pre-pandemic diagnoses of depression were primarily associated with excessive sleep (more than nine hours on working days), risk of depression during the pandemic was also associated with insufficient sleep (less than seven hours on working days). These differences suggest that people who already slept less before the pandemic were more susceptible to the uncertainty and changing living arrangements during the pandemic, which in turn led to their increased risk of depression. While the presence of a somatic disease before 2016 increased the odds of being diagnosed with depression between 2016 and 2020, this association was absent in the context of the pandemic.
J1.4.4.R
maiko.koort
2023-06-20
library(ggplot2)

#faili sisselugemine
J144=read.csv2("PT1-T1.4-J1.4.4.csv",header=TRUE, encoding ="UTF-8")
J144$odds.ratio=as.numeric(J144$odds.ratio)
J144$odds.ratio=as.numeric(J144$odds.ratio)
J144$Lower.95..CI=as.numeric(J144$Lower.95..CI)
J144$Higher.95..CI=as.numeric(J144$Higher.95..CI)
J144$Faktor=reorder(J144$Faktor,rev(J144$Jk))
J144$Paneel[J144$Paneel==1]="a"
J144$Paneel[J144$Paneel==2]="b"
J144$col="#FF3600"
J144$col[J144$odds.ratio==1]="#668080"
col=J144$col

#joonis
ggplot(J144,aes(x=Faktor,y=odds.ratio))+
  facet_grid(~Paneel)+
  geom_point(col=col,cex=2)+
  geom_errorbar(aes(ymin=Lower.95..CI,ymax=Higher.95..CI),width=0.2,linewidth=0.5,col=col)+
  geom_abline(slope=0,intercept=1,col="#668080")+
  theme_minimal()+
  coord_flip()+
  scale_y_continuous(limits=c(0.75,4.25),breaks=seq(0.75,4.25,0.25))+
  theme(axis.text.x = element_text(angle = 90))+
  xlab("")+
  ylab("")+
  theme(text = element_text(color="#668080"),axis.text=element_text(color="#668080"))+
  theme(strip.text.x = element_text(face = "bold",size=15,color="#668080"))
Depression risk is associated with the psychosocial environment
In the following, we present the effects of the most empirically confirmed environmental factors on the risk of depression, based on self-reports from the first wave of the Estonian National Mental Health Study (January–February 2021). More specifically, we assessed the effect of factors such as education, income, presence of chronic illness, the presence of a previously diagnosed mental health disorder, perceived social support and the experience of intimate partner violence, using a logistic regression prediction model, taking into account age, gender and nationality. The odds ratios of the characteristics that were statistically significant in predicting the risk of depression are presented in Figure 1.4.5.
Although education and nationality both increased the risk of depression individually, both remained insignificant in predicting the risk of depression when other factors were taken into account. The results show that women were 1.3 times as likely as men to experience depression and 2.3 times as likely as men to experience depression in the event of financial difficulties (in other words, if there is not enough money to live on and put aside). Age is also an important predictor of the risk of depression: there is a higher risk among younger age groups. For example, people aged 18–29 were 4.7 times as likely to be depressed as the oldest age group (over 70).
A chronic illness and a previously diagnosed mental health disorder were the two health-related factors that significantly predicted the risk of depression. People with a chronic illness are 1.6 times as likely to be depressed, and those with a pre-existing mental health disorder are 3.6 times as likely to be depressed.
J1.4.5.R
maiko.koort
2023-06-20
library(ggplot2)
library(tidyr)

#faili sisselugemine ja andmete formaadi korrigeerimine
J145=read.csv("PT1-T1.4-J1.4.5.csv",header=TRUE, encoding ="UTF-8")
J145=J145[,1:4]
names(J145)[2:4]=c("OR","lower","upper")
J145$X=as.factor(J145$X)
J145$X=factor(J145$X,rev(levels(J145$X)[order(c(6,9,8,1,4,7,2,3,5))]))


#joonis
ggplot(J145,aes(x=X,y=OR))+
  geom_point(cex=3,col="#FF3600")+
  geom_errorbar(aes(x=X,ymin=lower,ymax=upper),width=0.1,linewidth=0.7,col="#FF3600")+
  theme_minimal()+
  theme(text = element_text(color="#668080"),axis.text=element_text(color="#668080"))+
  coord_flip()+
  xlab("")+
  ylab("")+
  scale_y_continuous(limits=c(1,7),breaks=c(1,2,3,4,5,6,7))
Factors related to family and intimate relationships, specifically intimate partner violence and lack of social support, also play an important role in predicting the risk of depression. The analysis showed that the presence of perceived social support, such as knowing that one could count on the help of loved ones, was an important factor in fending off depression: the absence of social support made depression 3.2 times as likely. Intimate partner violence experienced in the last year predicts a 2.3-fold increase in the odds of having depression, and intimate partner violence experienced at some point in life predicts a 1.4-fold increase in the odds of having depression.
The occurrence of mental health problems is relatively frequent among the Estonian population. Based on self-reports, one in four adults is at risk of depression, and one in five is at risk of generalised anxiety disorder. The risk is significantly higher in young adults. Our registry study found that from 2016 to 2020, nearly a fourth of adults were diagnosed with at least one mental disorder, most frequently depression (12%) or anxiety disorders (10%). Since the pandemic started, the risk of depression and anxiety disorders in the population has increased.
Both genetic and environmental risk factors contribute to the manifestation of mental health problems. Depression that was diagnosed before the pandemic was most strongly associated with being female and having a high genetic predisposition, followed by lifestyle factors (smoking, alcohol abuse and drug use). During the pandemic, the factor most strongly associated with the risk of self-reported depression was younger age, followed by female gender, genetic predisposition, and alcohol and drug use.
While self-report surveys show that young adults are at higher risk of mental health disorders, registry data indicate that they are not more frequently diagnosed.
The current data do not allow us to determine the causes. Higher risk scores in young people may indicate a greater number of mental health problems, but they may also indicate higher stress levels, which are temporary. Different attitudes and the lack of stigma are another possible cause: young people are more willing to accept the possibility of a mental health problem and do not treat it with as much shame as older generations did.
The focus on gender differences in this article may give the impression that women are more likely to have mental disorders, when in fact, gender differences depend on the mental disorder. It has been found that while internalising disorders (which include depression and anxiety disorders) are more common in women, externalising disorders (which include behavioural disorders, attention deficit disorders and disorders related to alcohol and drug abuse) are more common in men (Eaton et al. 2012). However, due insufficient data, externalising disorders were not discussed in this article, except for alcohol abuse, which was more frequently found in men.
Finally, it is worth considering the role of the method used to collect data on mental health problems. Questionnaires typically overestimate the presence of disorders, while one-to-one interviews (as used in many health studies) discourage the disclosure of mental health problems, meaning that they might go undetected. Estimating the prevalence of disorders based on diagnosed cases relies on the assumption that services are easily accessible to all those in need of help (since getting diagnosed requires using a service) and that everyone with mental health concerns is well-informed about the options for getting help. Only then is it possible to assume that the statistics of diagnosed mental health disorders reflect the actual prevalence of disorders. If access to mental health services is limited, and mental health disorders and getting treatment are looked down on and stigmatised, assessments based on diagnosed cases are likely to underestimate the actual prevalence.
Aluoja, A., Shlik, J., Vasar, V., Luuk, K., Leinsalu, M. 1999. Development and psychometric properties of the Emotional State Questionnaire, a self-report questionnaire for depression and anxiety. – Nordic Journal of Psychiatry, 53(6), 443–449. https://doi.org/10.1080/080394899427692.
Bush, K., Kivlahan, D. R., McDonell, M. B., Fihn, S. D., Bradley, K. A., for the Ambulatory Care Quality Improvement Project (ACQUIP) 1998. The AUDIT Alcohol Consumption Questions (AUDIT-C): An effective brief screening test for problem drinking. – Archives of Internal Medicine, 158(16), 1789–1795. https://doi.org/10.1001/archinte.158.16.1789. Eaton, N. R., Keyes, K. M., Krueger, R. F., Balsis, S., Skodol, A. E., Markon, K. E., Grant, B. F., Hasin, D. S. 2012. An invariant dimensional liability model of gender differences in mental disorder prevalence: Evidence from a national sample. – Journal of Abnormal Psychology, 121(1), 282–288. https://doi.org/10.1037/a0024780.
Ferrari, A. et al. 2022. Global, regional, and national burden of 12 mental disorders in 204 countries and territories, 1990–2019: A systematic analysis for the Global Burden of Disease Study 2019. – Lancet Psychiatry, 9, 137–150 https://doi.org/10.1016/S2215-0366(21)00395-3.
Howard, D. M., Adams, M. J., Clarke, T. K., Hafferty, J. D., Gibson, J., Shirali, M., Coleman, J. R. I., Hagenaars, S. P., Ward, J., Wigmore, E. M., Alloza, C., Shen, X., Barbu, M. C., Xu, E. Y., Whalley, H. C., Marioni, R. E., Porteous, D. J., Davies, G., Deary, I. J., … McIntosh, A. M. 2019. Genome-wide meta-analysis of depression identifies 102 independent variants and highlights the importance of the prefrontal brain regions. – Nature Neuroscience 2019 22:3, 22(3), 343–352. https://doi.org/10.1038/s41593-018-0326-7.
Kendall, K., Van Assche, E., Andlauer, T., Choi, K., Luykx, J., Schulte, E., Lu, Y. 2021. The genetic basis of major depression. – Psychological Medicine, 51(13), 2217–2230. https://doi.org/10.1017/S0033291721000441.
Legge, S., Santoro, M., Periyasamy, S., Okewole, A., Arsalan, A., Kowalec, K. 2021. Genetic architecture of schizophrenia: A review of major advancements. – Psychological Medicine, 51(13), 2168–2177. https://doi.org/10.1017/S0033291720005334.
OECD 2018. Health at a Glance: Europe 2018: State of Health in the EU Cycle. Brussels, Paris: European Union, OECD Publishing. https://doi.org/10.1787/health_glance_eur-2018-en.
Santomauro, D. F., Mantilla Herrera, A. M., Shadid, J., Zheng, P., Ashbaugh, C., Pigott, D. M., Abbafati, C., Adolph, C., Amlag, J. O., Aravkin, A. Y., Bang-Jensen, B. L., Bertolacci, G. J., Bloom, S. S., Castellano, R., Castro, E., Chakrabarti, S., Chattopadhyay, J., Cogen, R. M., Collins, J. K., … Ferrari, A. J. 2021. Global prevalence and burden of depressive and anxiety disorders in 204 countries and territories in 2020 due to the COVID-19 pandemic. – Lancet, 398(10312), 1700–1712. https://doi.org/10.1016/S0140-6736(21)02143-7.
Sjöberg, L., Karlsson, B., Atti, A.-R., Skoog, I., Fratiglioni, L., Wang, H.-X. 2017. Prevalence of depression: Comparisons of different depression definitions in population-based samples of older adults. – Journal of Affective Disorders, 221, 123–131. https://doi.org/10.1016/j.jad.2017.06.011.
Steel, Z., Marnane, C., Iranpour, C., Chey, T., Jackson, J. W., Patel, V., Silove, D. 2014. The global prevalence of common mental disorders: A systematic review and meta-analysis 1980–2013. – International Journal of Epidemiology, 43 (2), 476–493. https://doi.org/10.1093/ije/dyu038.
WHO 2022. World mental health report: Transforming mental health for all. Geneva: World Health Organization. https://www.who.int/publications/i/item/9789240049338.