Success: Self-realisation as part of mental wellbeing
As the World Health Organization (WHO) defines it, mental health is a state of wellbeing in which the individual realises their own abilities, can cope with the normal stresses of life and can work productively. This article focuses on the topic of self-realisation, or success, in school and work life, as well as on the values associated with work and success.
Self-determination theory (Ryan 2009) is a theoretical model that describes people’s psychological needs, such as the need for success through self-realisation, and the motivation related to this need. (Ryan 2009). According to this theory, maintaining mental health and wellbeing requires satisfying three universal needs: the need for autonomy, competence and relatedness. These needs are inextricably linked to success in both school and work life.
Independent achievement in any field is based on competence and supports a sense of autonomy while being connected to the psychosocial environment that one is part of and participates in on a daily basis. Setting and achieving autonomous goals (self-realisation) encourages the development of coping mechanisms and thereby reduces stress, thus contributing to the maintenance and improvement of both physical and mental health and wellbeing (Miquelon and Vallerand 2008). It is also important to address achievement-related values. According to self-determination theory, it is values related to self-realisation that mostly contribute to wellbeing. Excessive emphasis on external success criteria (e.g. salary or grades) can, by contrast, increase stress and thereby pose a risk to mental health.
Since it is nearly impossible to measure success in its entirety, this article will focus on success in two areas where it can be measured relatively well: in school and in work life. As a third topic, we will consider work-related values that form the social background of the pursuit of success. We will look at socioeconomic factors that influence success (e.g. parents’ education and income, the socioeconomic background of schools), educational resources and attitudes at home, and work values.
Success in education opens more avenues for self-realisation in the professional world. However, it is important to view students’ success and self-realisation from a broader perspective, one that includes mental wellbeing. Therefore, success in school is measured not only in academic achievements but also by considering students’ attitudes towards learning, the inner satisfaction they get from being in school and studying, and their learning motivation. This article focuses on academic achievements; the school environment and wellbeing of students at school are discussed in the article by Valk et al. in Chapter 3 of this report. The positive correlation between learning motivation and student self-efficacy with academic achievements is widely acknowledged in educational sciences. The association of academic results with students’ epistemic beliefs1 is similarly notable. More specifically, many studies have shown that more educated beliefs about the nature of knowledge (in favour of the scientific method) are associated with better academic results in mathematics and other STEM2 hariduses (Mason et al. 2013; Rozgonjuk et al. 2022).
Since 2006, Estonian students have participated in the worldwide educational study Programme for International Student Assessment (PISA). The data of this study are a valuable source of information if, in addition to the students’ academic results in achievement tests, we are interested in the students’ attitudes towards learning, or in knowing how our students are doing in school in the broader sense.
Estonian students have scored relatively high by international comparison on the most recent PISA achievement tests (OECD 2016; OECD 2019). The sample of the PISA study includes students aged around 15 years, who are typically studying in the last grades of lower secondary school. That means that they will soon be moving on to the next educational stage: upper secondary school. Which indicators characterise these students, who will soon have to choose where they want to continue their studies? And following their educational path even further: which indicators predict their success at the end of upper secondary school and thereby provide them with greater options when heading on to the next educational stage?
To answer these questions, we took a closer look at the PISA 2015 data. That year, 5,587 students from all across Estonia, or about half of all the 15-year-old students in Estonia, participated in the study (INNOVE 2016). To the PISA study data, we added the results of the students’ mathematics finals taken in the last year of lower secondary school and the results of the state examination in standard or advanced mathematics taken at the end of higher secondary school three years later. In other words, we monitored the further educational path of the students who participated in the PISA 2015 study and tried to understand which attitudinal or demographic indicators measured in the PISA study predicted the students’ later educational path.
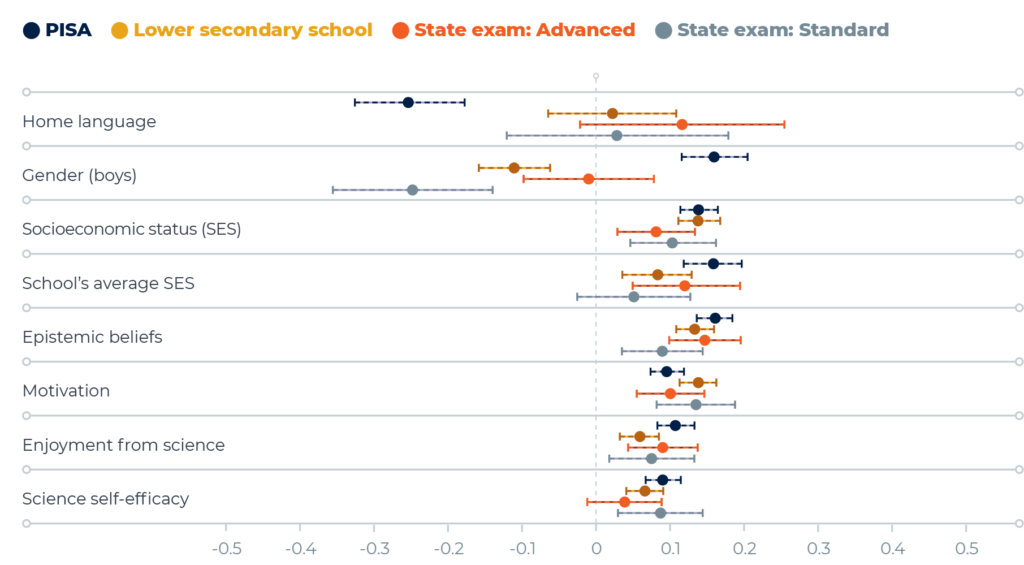
Firstly, Figure 1.3.1, shows us that the academic performance of 15-year-old students was related to various attitudes that the PISA background questionnaire asked them about. There were several questions about each attitude. We have extracted the underlying themes in these questions and present them in the following points.
- Epistemic beliefs: the belief that scientific methods are the source of knowledge (e.g. that knowledge can change depending on the results of an experiment).
- Achievement motivation: wanting to study well and be among the best.
- Enjoyment from science: interest and positive attitude towards natural sciences.
- Self-efficacy in science: the student’s belief that they can handle various science-related tasks (e.g. explain the causes of earthquakes).
All four of these attitudes had a positive correlation with both PISA performance and the results of final exams, including state exams taken three years later. Although these correlations were slight or moderate, they were almost always statistically significant. It is worth noting that these associations cannot be attributed to the students’ socioeconomic background, gender or home language, which were all included in the model concurrently.
Secondly, Figure 1.3.1, demonstrates that boys performed better on the PISA test, while girls had the upper hand in the finals. An exception is the state exam in advanced mathematics, where boys and girls performed on an equal level.
Thirdly, we can see from the figure that higher socioeconomic status also predicts better performance. The socioeconomic status index of the PISA background questionnaire reflects the educational level of the student’s parents, the number of books at home, the availability of digital tools, and the number of rooms and cars at home. This index is therefore less of an indicator of wealth and more of an indicator of parents’ education and the educational resources available at home (dictionaries, digital tools). It is worth noting that the average socioeconomic status index of the school has just as much impact as the socioeconomic status indicator of the student’s home environment.
We described the associations of success in school based on mathematics results, because mathematics shows the clearest connection between the subject studied at school and the PISA subtest. However, we found a similar association pattern with background factors (including socioeconomic status and attitudes) in the PISA reading test and science test (the latter includes questions from the physics, chemistry and biology curriculum).
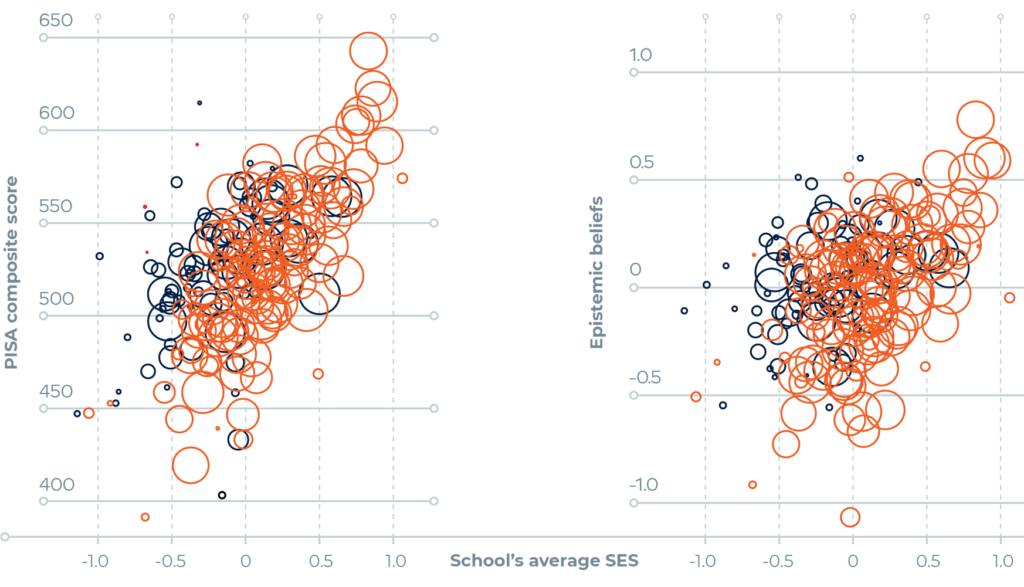
Figure 1.3.2. illustrates the differences between schools. The better the average socioeconomic status index of the school, the better the average PISA score and the higher the epistemic beliefs score. Other attitudes (including in self-efficacy in the field of study and achievement motivation) were also associated with socioeconomic background, but these relationships were not as strong. In addition, the same figure highlights the differences between rural and urban schools. Only urban schools with high socioeconomic status achieve very high average PISA performance scores.
What can we conclude from these results?
- There are significant differences in academic performance between schools. Some of these differences can be attributed to differences in socioeconomic background.
- Socioeconomic background affects academic performance not directly but through mediating variables. Examples of such mediating variables are educational resources and attitudes that encourage the education process. Educational resources include financial opportunities, books and digital tools available at home, and the parents themselves. Better-educated parents are better prepared to help their children with schoolwork, as well as simply to have educational conversations.
- Socioeconomic differences between schools are significant and result from both regional differences and the concentration of students with similar backgrounds in the same schools. Socioeconomic differences are related to differences in attitudes that encourage success in school.
- Attitudes that encourage success in school affect students’ success in school regardless of their gender or socioeconomic background. This effect is long-term (lasting at least from the end of lower secondary school to the end of higher secondary school) and is reflected in the results of both the PISA test and the final exams.
- Thus, in efforts to reduce inequalities between schools, it is not enough to rely only or mainly on the quality of teaching and good learning methods. It should be recognised that some of the differences stem from students’ home background, including their socioeconomic background and the attitudes that encourage success in school.
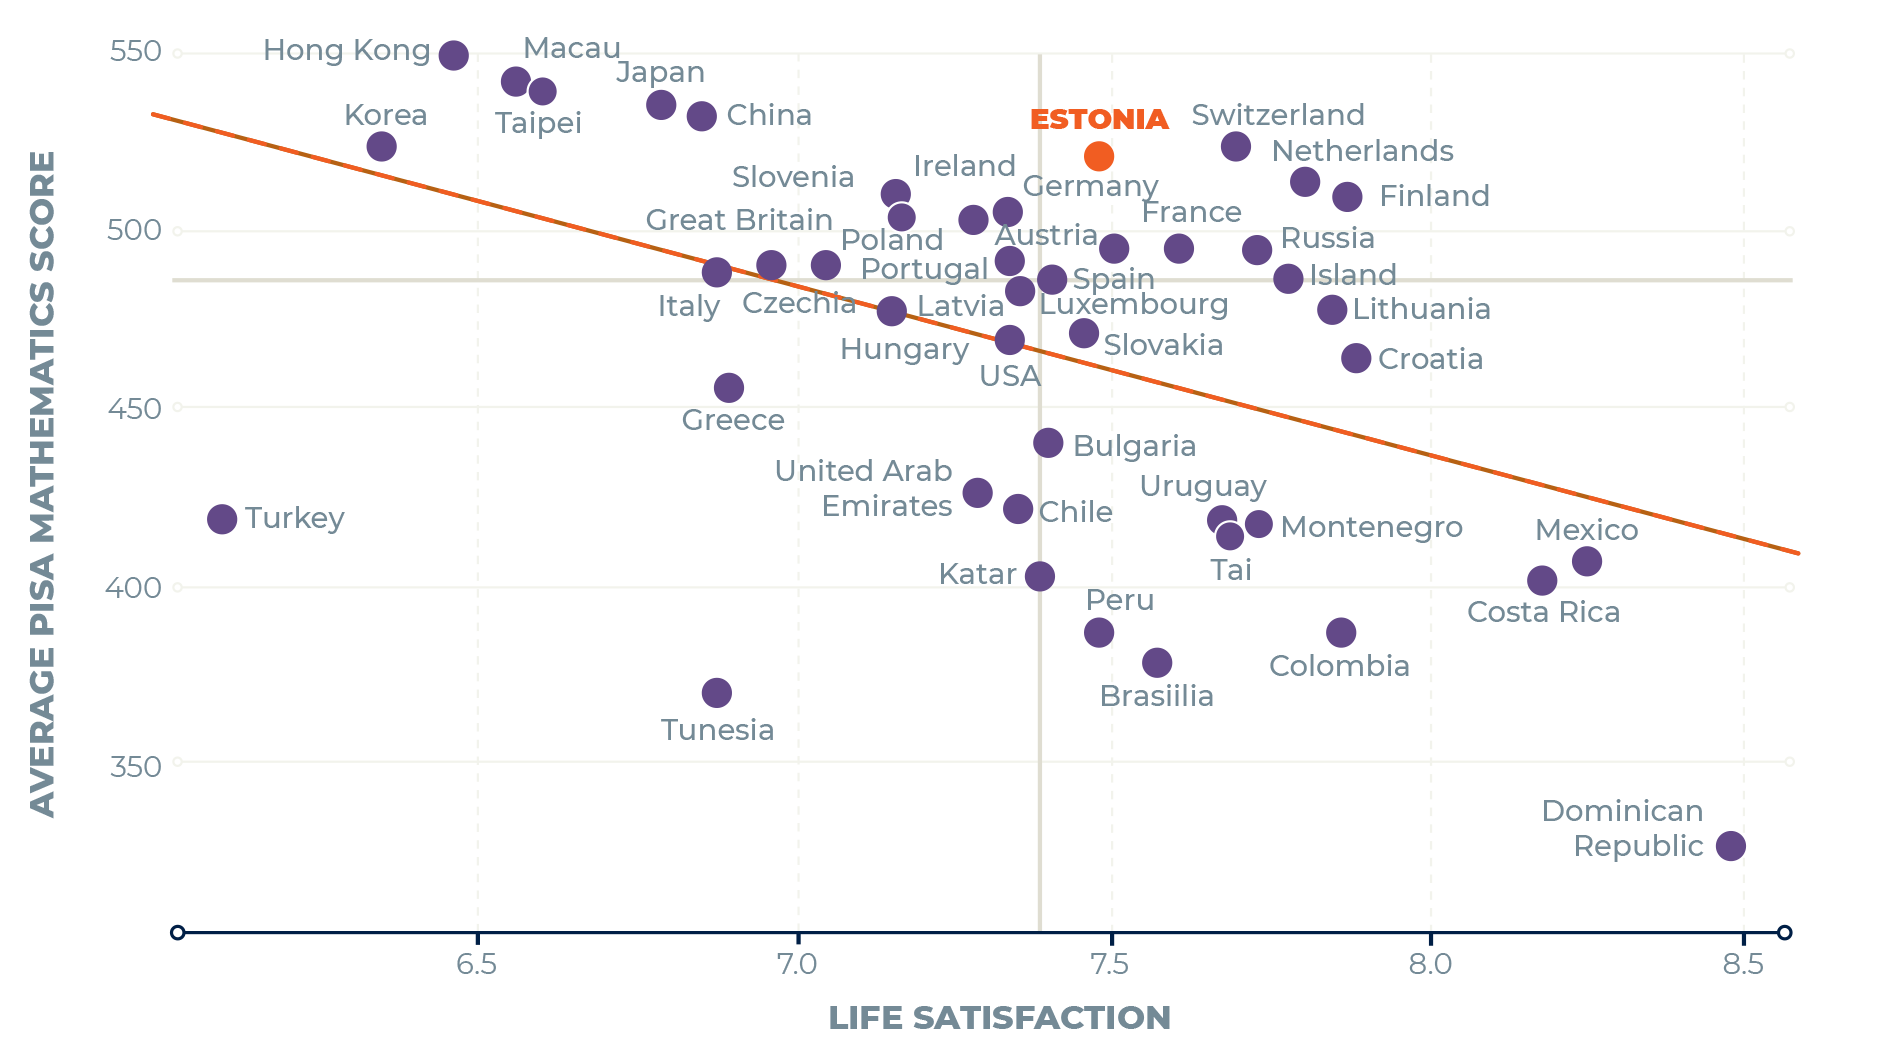
In the PISA 2015 study, students were asked a single additional question: ‘How satisfied do you feel about your life?’ According to the summary figure based on the PISA 2015 country data (Figure 1.3.3) Estonian students were quite satisfied with their lives: Estonian students scored an average of 7.5 out of 10.
Compared to other OECD countries, Estonian students’ life satisfaction was slightly above average. Figure 1.3.3 shows a moderately strong negative correlation between life satisfaction and mathematics results: in countries with the best mathematics results, life satisfaction is usually lower on average, and vice versa. There are a few exceptions to this pattern: Estonia, along with Finland, Switzerland, the Netherlands and others, has higher-than-average life satisfaction and PISA mathematics scores.
Income is far from being the only criterion of professional success, but compared to the alternatives (such as the meaningfulness of work, a sense of competence, or feedback from superiors or clients), it is both easily and accurately measurable (if we limit ourselves to legal incomes) and universal (higher income is preferable to lower income in any given occupation). That is why we consider income as the measure of success at work in this article.
Much like success in school, success in work is largely dependent on home background. Constituting this background are investments that are both direct (economic) and indirect (e.g. social capital), coupled with genetic and social heritage (e.g. family reputation, transmission of skills and knowledge). Among other things, the effect of home background can be observed in the correlation between children’s and parents’ incomes. This association is reflected in the registry data of the Estonian Tax and Customs Board shown in Figure 1.3.4.
Figure 1.3.4 presents Estonian residents who were 34–36 years old in 2017 as ‘children’. The horizontal axis shows the employment income of the parents of these children in 2007 (the time when most of the children had entered or were entering the labour market). Families have been split into percentiles based on the sum total of both parents’ income, resulting in a categorisation of 100 equal-sized groups ranked by income. The 9% of families who had no income at the time are depicted as the point farthest left. The vertical axis shows the average income of the descendants (children) of parents belonging to each percentile group in 2017, also on the percentile scale. Families where both parents were born in Estonia and families where both parents were born outside Estonia are presented as separate groups (for clarity, ‘mixed’ families were not included in the figure).
Figure 1.3.4 shows that for both groups, the relationship between children’s and parents’ incomes is approximately linear. The higher the parents are positioned in the income hierarchy, the higher on average the children land in the income distribution. Although the correlation is significant, it is not as strong as in some other countries: Estonia falls roughly in line with the Nordics and lower than Germany or Great Britain. (Corak 2016).
Parents’ position in income distribution is therefore not as strong in determining the child’s future as in some other countries. In other words, intergenerational income mobility is relatively high in Estonia.
The relationship between children’s and parents’ income is approximately the same in families with an Estonian or local background, and in families with a foreign background (both regression lines have the same slope; see Figure 1.3.4). That means that children from families with a foreign background are not more limited by their parents’ income position than local children. On the other hand, other factors (e.g. poor knowledge of Estonian, limited social network, etc.) prevent children with a foreign background, most of whom are Russian-speaking, from gaining success in the labour market. Thus the income of children from families with a foreign background is lower on average than that of children from families with a local background.
Parents in families with a foreign background have, on average, a smaller income than those from families with a local background (vt Kivi et al. 2021, Figure 1.3.4), The same applies for children from families with a foreign background compared to those with a local background. In both generations, the income gap is approximately the same. Therefore, even though the relationship between parents’ and children’s incomes is not very strong in Estonia, there is still a national-background-based difference in average incomes among both first- and second-generation immigrants.
J1.3.4.R
maiko.koort
2023-06-20
library(tidyr)
library(ggplot2)
library(plotly)
##
## Attaching package: 'plotly'## The following object is masked from 'package:ggplot2':
##
## last_plot## The following object is masked from 'package:stats':
##
## filter## The following object is masked from 'package:graphics':
##
## layout#faili sisselugemine ja andmete formaadi korrigeerimine
J134=read.csv("PT1-T1.3-J1.3.4.csv",header=TRUE, encoding ="UTF-8")
#joonis
ggplot(J134,aes(x=pererank_sum,y=lapserank,col=Family.type,group=Family.type))+
geom_point(cex=2.5)+
geom_smooth(method="lm", linewidth=0.8,se=FALSE)+
theme_minimal()+
scale_y_continuous(limits=c(30,70))+
scale_color_manual(values=c("#1E272E","#FF3600"))+
theme(text = element_text(color="#668080"),axis.text=element_text(color="#668080"))+
ylab("Average income of the child on the percentile scale")+
xlab("Parents’ income percentile")+
theme(legend.title=element_blank(),legend.position = c(0.2,0.8))## `geom_smooth()` using formula = 'y ~ x'
Figure 1.3.5 shows the relationship between age and pay in Estonia for the years 2007 and 2017.
In the case of individual age-pay profiles,
pay typically increases rapidly for the first 10–15 years after entrance into the labour market, then stabilises and then falls slightly just before retirement age (e.g. due to deteriorating health).
Instead of individual data, the profiles here are based on cross-sectional data. Thus, a decrease in pay is likely to indicate generational differences – it is not that people in their 40s start earning less but that younger generations earn more than them on average.
There are two striking differences in the cross-sectional age-pay profile of Estonian residents that set the country apart from those where development has followed a more stable course (nt (e.g. Finland)). First, the pay increase in the first decades after entrance into the labour market is steeper in Estonia. Second, the age-pay curve in Estonia peaks in people’s 30s and 40s and starts falling after that. In Finnish data, a certain decrease is detected only among those with the least education, while in all other strata of the population, pay increases throughout the working years. Figure 1.3.5 also shows that during the last decade, the peak of the income curve has shifted to the right, moving from the late 20s to the late 30s. We can expect this process to continue for a quarter-century, until our age-pay profile resembles that of countries with a stable development arc.
J1.3.5.R
maiko.koort
2023-06-20
library(tidyr)
library(ggplot2)
library(plotly)
##
## Attaching package: 'plotly'## The following object is masked from 'package:ggplot2':
##
## last_plot## The following object is masked from 'package:stats':
##
## filter## The following object is masked from 'package:graphics':
##
## layout#faili sisselugemine ja andmete formaadi korrigeerimine
J135=read.csv("PT1-T1.3-J1.3.5.csv",header=TRUE, encoding ="UTF-8")
J135$YEAR=as.factor(J135$YEAR)
names(J135)[1]="Year"
#joonis
ggplot(J135,aes(x=age,y=averagepay,col=Year))+
geom_line(linewidth=1)+
theme_minimal()+
scale_y_continuous(breaks=c(0,500,750,1000,1250))+
scale_color_manual(values=c("#1E272E","#FF3600"))+
theme(text = element_text(color="#668080"),axis.text=element_text(color="#668080"))+
theme(legend.position="top",legend.title=element_blank())+
ylab("Average pay")+
xlab("Age")
Figure 1.3.5 illustrates the dynamics of the Estonian labour market: the newer generations have been more successful than the ones that came before them. In the early 1990s, people feared that the restoration of independence would be followed by a ‘winners’ generation’ that would steal opportunities from the generations to come. Instead, each new generation seems to have been more successful in the labour market than the ones before them.
On the one hand, this can be considered a success – our education system has adapted to the new circumstances and is increasingly effective in preparing young people. On the other hand, however, the large income gap between generations leads to many problems. Let us look at a few of them.
- Many professions (especially in the public sector) inevitably have a relatively fixed, seniority-based pay policy. This is why, for example, we cannot offer young teachers higher pay than older ones, even though the competition in the labour market requires us to attract more young people to work as teachers. This results in the aging of the teaching staff and major problems looming in the education system.
- People retiring today have significantly lower incomes than those who will retire in 20 years. This means that in 20 years, the decline in income for people reaching retirement age will be much steeper than it is now, which may become an important factor influencing policy decisions.
A similar dynamic, where the pay level of the generations entering the labour market exceeds that of the ones before them, will likely continue in the coming years. This is because the generation now entering the labour market is smaller than previous generations. This is likely to increase the average pay mainly among young, highly educated people who often enter sectors where there are few or no highly educated people from older generations. The competition for them is growing, and this is reflected in pay figures.
The gender pay gap in Estonia is still the largest in Europe (21.7% in 2019, compared to the European average of 14.1%, according to Eurostat data). While there are many reasons for the pay gap, it ultimately indicates that women have fewer opportunities for self-realisation than men do.
Work values refer to the main objectives that are reached through work and the opportunities for self-realisation that work presents. Based on motivational factors, we can broadly differentiate between two types of work values: extrinsic and intrinsic. Extrinsic values (income, career, prestige associated with the profession) refer to tangible rewards or benefits; intrinsic values refer to intangible benefits gained through the nature of the work (creativity, self-development, opportunities for achievement) (Gesthuizen et al. 2019).
Summarising the systematic study of young people’s work values that started in Estonia in the 1960s, Saarniit (2000) notes that the structure of previously stable work values changed radically in the 1990s. During the Soviet period, the cultural contribution of one’s work was valued the highest, with material goals and especially position-related values rated as less relevant. However, the early 1990s brought systematic changes in the hierarchy of these values: the worsened economic situation that followed the collapse of the Soviet Union saw a sharp shift in work values. Career opportunities and especially material well-being gained in value, and self-realisation opportunities at work lost the value they once had. The values of the Russian-speaking population were especially quick to take a pragmatic turn, which led to a decrease in the ethnic differences in work values seen in the 1980s.
Research conducted in subsequent decades shows the prevalence of material work values in the entire population. According to the international European Values Study (EVS) Estonia is not alone in this: in recent decades, remuneration for work has been the number-one work value in all former socialist countries that have transitioned to a market economy (Figure 1.3.6). Residents of countries with lower purchasing power parity consider income more important when choosing a job than residents of wealthier countries do. In this classification, Estonia is closer to Eastern European countries than to the Nordics.
J1.3.6.R
maiko.koort
2023-06-20
library(ggplot2)
library(plotly)
##
## Attaching package: 'plotly'## The following object is masked from 'package:ggplot2':
##
## last_plot## The following object is masked from 'package:stats':
##
## filter## The following object is masked from 'package:graphics':
##
## layout#faili sisselugemine ja andmete formaadi korrigeerimine
J136=read.csv2("PT1-T1.3-J1.3.6.csv",header=TRUE, encoding ="UTF-8")
J136$col="#6666cc"
J136$col[J136$Riik=="ESTONIA"]="#FF3600"
col=J136$col
#joonis
ggplot(J136,aes(x=SKP,y=Palk))+
geom_point(cex=4,col=col)+
geom_smooth(method="lm", linewidth=1,col="#FF3600",se=FALSE)+
theme_minimal()+
geom_text(aes(x=SKP+3,y=Palk+1.5,label=Riik),col="#668080")+
theme(text = element_text(color="#668080"),axis.text=element_text(color="#668080"))+
theme(legend.position = "none")+
scale_x_continuous(breaks=seq(0,200,20))+
ylab("%")+
xlab("GDP at purchasing power parity")## `geom_smooth()` using formula = 'y ~ x'
The emphasis on opportunities for achievement at work has steadily grown in Estonia in recent decades. This trend reflects the increasingly complex demands placed on employees in the rapidly developing labour market. In Estonia, opportunities for achievement are valued less than in Scandinavian countries and more than, for example, in Russia. They are more desired among Estonian-speakers than they are among Russian-speaking respondents. Estonian residents with a higher education value opportunities for achievement more than residents with a lower education do (Figure 1.3.7).
J1.3.7.R
maiko.koort
2023-06-20
library(ggplot2)
library(tidyr)
#faili sisselugemine ja andmete formaadi korrigeerimine
J137=read.csv("PT1-T1.3-J1.3.7.csv",header=TRUE, encoding ="UTF-8")
names(J137)[2:4]=c("1999","2008","2018")
J137=pivot_longer(J137,c("1999","2008","2018"))
names(J137)=c("Education","Year","Protsent")


#joonis
  ggplot(J137,aes(x=Year,y=Protsent,col=Education))+
  geom_point(cex=3)+
  geom_line(aes(col=Education,group=Education),linewidth=1.5)+
  scale_y_continuous(breaks=seq(0,100,10),limits=c(0,90))+
  scale_color_manual(values=c("#FF3600","#38bf7b","#6666cc","#1E272E"))+
  theme_minimal()+
  theme(text = element_text(color="#668080"),axis.text=element_text(color="#668080"))+
  theme(legend.position = "bottom")+
  ylab("%")
The modernisation of the labour market in this period is also reflected in accelerated individualisation, as is indicated by the consistent increase in the share of Estonians who believe that people should be more responsible for their own livelihoods. There were no gender differences in this opinion, but it was more common among Estonian-speaking respondents than Russian-speaking ones (Figure 1.3.8).
The increasing emphasis on individual competitiveness is another trend that indicates the prevalence of neoliberal thinking. More and more people believe that competition could stimulate people to work harder and employ new ideas. In contrast to the growing emphasis on individual responsibility and competition, there has been increased dissatisfaction with income differences. Since the 1990s, the number of those who believe that higher pay makes people work harder has decreased, and the number of those supporting a more equitable redistribution of income has increased. The number of people upholding ‘post-materialist’ values has also grown (Realo 2019).
J1.3.8.R
maiko.koort
2023-06-20
library(ggplot2)
library(tidyr)
#faili sisselugemine ja andmete formaadi korrigeerimine
J138=read.csv("PT1-T1.3-J1.3.8.csv",header=TRUE, encoding ="UTF-8")
names(J138)[2:4]=c("1999","2008","2018")
J138x=J138[1:2,]
J138y=J138[4:5,]
J138x=pivot_longer(J138x,c("1999","2008","2018"))
names(J138x)=c("Rahvus","Year","Assessment")
J138y=pivot_longer(J138y,c("1999","2008","2018"))
names(J138y)=c("Rahvus","Year","Assessment")


#joonis1
ggplot(J138x,aes(x=Year,y=Assessment,col=Rahvus))+
  geom_point(cex=3)+
  geom_line(aes(col=Rahvus,group=Rahvus),linewidth=1.5)+
  theme_minimal()+
  theme(legend.position = "bottom",legend.title = element_blank())+
  scale_color_manual(values=c("#6666cc","#FF3600"))+
  theme(text = element_text(color="#668080"),axis.text=element_text(color="#668080"))+
  scale_y_continuous(limits=c(1,10),breaks=seq(1,10,1))+
  ylab("Hinnang")
The dynamics of work values and individual achievement indicators are a sign of broader developments that have followed the changes in well-being and that describe both the labour market and society at large. In recent decades, the receding of daily subsistence concerns brought on by the increase in general well-being and the ever-increasing need for specialised labour sparked by the deepening division of labour have led to an increased emphasis on intrinsic work values. Although remuneration continues to be an essential motivating factor when choosing a job, more and more consideration is given to the opportunities for achievement that the workplace can offer. Another sign of adaptation to the demands of a market economy society is that instead of relying on state aid, people prefer to rely more and more on themselves. At the same time, the deepening of economic inequality is receiving more criticism. People with higher education and Estonian-speakers are better adapted to the changing circumstances.
Self-realisation, or success, is an important component of mental health and wellbeing.
In the first part of this article, we demonstrated that students’ success in school is influenced by their parents’ education and the educational resources and attitudes they are exposed to at home. There are significant differences in Estonian schools’ average PISA results and the average state examination results. The different socioeconomic backgrounds and attitudes among students offer some explanation for this.
There is a positive correlation between parents’ income and the income of their children in adulthood, although it is not as strong as in many other countries. The position of children in later life is therefore not very strongly limited by the opportunities their parents offer them during childhood. The younger generations earn significantly more than the older ones. On the one hand, this signals that our education system has adapted to the changing economy. But on the other hand, it causes problems in the labour market (for instance, because the average pay level of teachers differs between age groups, older people find the average pay of teachers more motivating than younger people do). While Estonians consider income a very important motivator when choosing a job, intrinsic work values (e.g. opportunities for achievement) have become increasingly relevant in recent decades. People believe they need to support themselves without outside assistance. At the same time, there has been an increase in the number of people believing in the need to redistribute income more equally.
Corak, M. 2016. Inequality from generation to generation: The United States in comparison. IZA Discussion Papers, 9929.
Gesthuizen, M., Kovarek, D., Rapp, C. 2019. Extrinsic and intrinsic work values: Findings on equivalence in different cultural contexts. – Annals of the American Academy of Political and Social Science, 682(1), 60–83.
INNOVE 2016. PISA 2015. Uuringu kokkuvõte. Tallinn: SA Innove. https://www.innove.ee/uuringud/pisa-uuring/pisa-2015/, 8.12.2021.
Kivi, L. H., Järve, J., Anspal, S., Sõmer, M., Seppo, I. 2021. Are we there yet? Intergenerational mobility and economic assimilation of second-generation immigrants in Estonia. – Baltic Journal of Economics, 21 (2), 157−182. https://doi.org/10.1080/1406099X.2021.1993601.
Mason, L., Boscolo, P., Tornatora, M. C., Ronconi, L. 2013. Besides knowledge: A cross-sectional study on the relations between epistemic beliefs, achievement goals, self-beliefs, and achievement in science. – Instructional Science, 41(1), 49–79. https://doi.org/10.1007/s11251-012-9210-0.
Miquelon, P., Vallerand, R. J. 2008. Goal motives, well-being, and physical health: An integrative model. – Canadian Psychology / Psychologie canadienne, 49(3), 241–249.
OECD 2016. PISA 2015 Results (Volume I): Excellence and Equity in Education. Paris: OECD Publishing https://doi.org/10.1787/9789264266490-en.
OECD 2019. PISA 2018 Results: Combined Executive Summaries. Volumes I, II and III. https://www.oecd.org/pisa/Combined_Executive_Summaries_PISA_2018.pdf.
Realo, A. 2019. Väärtuste muutus aastatel 1990–2018 – Ingleharti kultuuriliste väärtuste dimensioonid. – Ainsaar, M., Strenze, T. (toim). Väärtused kui inimvara ja nende mõju ühiskonna arengule. Tallinn: Arenguseire Keskus, 19–35.
Rozgonjuk, D., Konstabel, K., Barker, K., Rannikmäe, M., Täht, K. 2022. Epistemic beliefs in science, socio-economic status, and mathematics and science test results in lower secondary education: A multilevel perspective. – Educational Psychology, 0(0), 1–16. https://doi.org/10.1080/01443410.2022.2144143.
Ryan, R. 2009. Self-determination theory and well-being. – Social Psychology, 84(822), 822–848.
Saarniit, J. 2000. Väärtusteadvus ja selle muutused. – Eesti noorsooraport: Eesti noorsoopoliitika ülevaade. Tallinn: Haridusministeerium, 217–225.
Tire, G., Puksand, H., Lepmann, T., Henno, I., Lindemann, K., Täht, K.,Lorenz, B., Silm, G. 2019. PISA 2018 EESTI TULEMUSED. Eesti 15-aastaste õpilaste teadmised ja oskused funktsionaalses lugemises, matemaatikas ja loodusteadustes. Tallinn: SA Innove.