A life course perspective on the associations between lifestyle and mental health in older age
Mental health is an important component of the general health status and wellbeing, affecting willpower and agency, the ability to function in daily life, and overall life satisfaction. Mental health problems occur more frequently in younger years (adolescence) and again in old age (WHO 2017; Laidra 2016).
There are various reasons for increased mental health issues later in life. The life course approach offers the most comprehensive framework, linking a person’s life events to age-specific changes and temporal and social dimensions (Elder et al. 2003). Ageing or getting older is not necessarily a depressing process in and of itself. According to the life course approach, the health of individuals is affected by their life experiences. The accumulation of negative, unfavourable or what are perceived as unusual conditions or events can lead to poorer health.
There are various life course mechanisms that affect health (Pearlin et al. 2005). First, the ways in which people assume social roles and achieve status throughout life may be different depending on their family background and childhood home conditions, as well as the neighbourhood they inhabit or grew up in. These past factors can affect health by limiting access to necessary information and resources. The accumulation of constant or repeated difficulties in key areas of life such as family or work can also have a negative impact on health. Persisting economic vulnerability or repeated threats to identity may affect health. Early traumatic experiences are another aspect that may lead to chronic stress and tension. Secondary stressors resulting from trauma and the increased likelihood of their post-traumatic occurrence may affect mental health in later life, mostly indirectly. Deviations from social norms in the timing and sequence of important life events may also create tensions by impacting access to certain opportunities in life (e.g. education or the labour market). Disruptions to the regular course of life, such as breakups, job loss or unexpected caregiving responsibilities, can have a greater impact on those who lack the necessary resources to cope with new situations.
Therefore, in addition to preventive measures that stress the role of individual responsibility and personal choice, social and economic adjustments on a national and community level also play an important role in improving health.
This article provides an overview of the association between lifestyle and mental health in people aged 65 and older by examining changes and differences in mental health in old age through lifestyle factors. For this, we will be relying on data from the SHARE (Survey on Health, Ageing and Retirement in Europe) longitudinal survey. This survey collects data on individual ageing, health and exiting the labour market in European countries.
Approaching health from a life course perspective makes it possible to evaluate and understand how experiences from various stages of life as well as different historical periods impact life in later years. Many stressful early life experiences or events can affect health later in life.
Relevant stressors that occur during sensitive or critical life periods can affect biological stress regulation mechanisms, the functioning of the nervous system or the expression of genetic predispositions as a stress reaction (WHO 2014). Lifestyle may also change in different periods of life in response to the surrounding social environment and the needs and opportunities of the individual. The aspects of lifestyle we will consider more closely are diet, physical activity, sleep patterns, smoking and alcohol consumption, as previous research has identified these as key factors for mental health.
Changes in diet can be viewed from a life course perspective. First, certain food-related attitudes and strategies develop at an early age and remain fairly stable throughout life (Devine 2005). Second, food choices and eating behaviours can change as a result of pivotal life events – for example, when people are suddenly faced with the need to take better care of their own health or that of loved ones, to improve self-efficacy through dietary choices, or to redefine themselves through food. Third, food choice is closely connected with the meaning attributed to and the norms associated with food, which may differ or change with social positioning, for example, reflecting social class, ethnic group, gender or generation. These links can manifest themselves in dietary habits, the role of food quality, access to different nutrients, and the availability of free time to prepare meals. Eating habits can also change across generations. For example, people born in the early 20th century grew up in an environment with fewer or different dietary guidelines than later generations. If the habits typical of a generation are sufficiently widespread or long-lasting, they can be reflected in population-level health indicators.
Physical activity can be understood as either a (health) behaviour or a habit: the former emphasises its cognitive, emotional and operational component, while the latter is an automatic and often subconscious activity (Hirvensalo and Lintunen 2011). From a life course perspective, it has been found that physical activity in childhood and adolescence predicts physical activity in adulthood, although many other factors influence adult physical activity in addition to childhood conditions. This association may function through motivation and the accumulation of experience. However, the relationship between physical activity in childhood and old age is already weaker, probably due to the long intervals that separate these life periods. Nevertheless, patterns of physical activity adopted early on in life can also influence physical activity in later life – for example, through the early acquisition of skills. A change in physical activity is also more likely when assuming new social roles (Hirvensalo and Lintunen 2011). Retirement has been associated with a decrease in physical activity, linked with, for example, the end of daily commuting. On the other hand, former sedentary workers have been found to become more physically active in this life stage.
While sleep provides relief from the problems of everyday life, the quality of sleep can similarly vary among people with different backgrounds and coping strategies. In general, sleep disorders are more common in people with a poorer socioeconomic situation. The reasons include structural disadvantages, related psychological stress, lifestyle
factors, and less knowledge about better sleep hygiene (van de Straat et al. 2020). In general, middle-aged and older women experience more sleep disorders than men of the same age. While men’s sleep disorders are only associated with their current socioeconomic status, women’s sleep disorders are associated with both their current socioeconomic conditions and those of their childhood. Therefore, growing up in poorer socioeconomic conditions affects the quality of sleep in older women, even if their socioeconomic situation improves later in life (van de Straat et al. 2020). Here, we should not forget that changes in sleep patterns and poor quality of sleep are also frequent symptoms of mental health problems.
Smoking and alcohol use are reflections of stress- or tension-responsive behaviour that can harm one’s health when done excessively, leading to addiction and mental health problems. In the older population, the abuse of tobacco and alcohol has generally been more common among men, with a greater effect on their morbidity and mortality. Because in Estonia, the life expectancy of men is significantly shorter than that of women, this effect on health outcomes may not be reflected in surveys, as respondents generally include healthier people and those who have survived longer.
Our analysis is based on data from the 2013 Estonian SHARE survey, which asked the respondents detailed questions about their childhood conditions, enabling us to consider various life course conditions. The data consists of answers given by people aged 65 and older who were interviewed in 2011 and again in 2013. We analysed the changes that had taken place in the respondents’ mental health in that period. The final Estonian sample included 2,026 individuals aged 65 and older (684 men and 1,342 women).
We mainly looked at the EURO-D depressiveness scale, which has been internationally developed, allows for comparisons and has been validated for the middle-aged and older population (Guerra et al. 2015). SThis scale measures the presence of 12 symptoms (including low mood, pessimism, suicidal thoughts, guilt, sleep disturbance, loss of interest, irritability, change in appetite, fatigue, poor concentration, lack of enjoyment and tearfulness) during the previous four weeks; the individual scores are summed to form a composite score, with higher values indicating depressiveness (score value over 3). The self-reported results do not indicate medically diagnosed depression, which means that the prevalence of self-reported depressiveness is significantly higher than the prevalence of depression. Nonetheless, the scale helps to estimate the number of people in need of some form of mental health (first) aid. Within this article, it is therefore more accurate to speak of ‘depressiveness’ or ‘depressive symptoms’.
In general, the average number of depressive symptoms among people aged 65 or older was relatively high in Estonia compared to the other countries surveyed. In 2011, the prevalence of depressiveness in Estonian respondents was 40% (46% in women, 29% in men). By 2013 it had somewhat decreased, settling at 38% (43% in women and 28% in men).
Although women had more depressive symptoms than men in both Estonia and other countries, men had a worse position than women in a European comparison (Figure 2.4.1). Estonian men had an average of 2.5 depressive symptoms. This was one of the highest scores in 2013 and was matched only by men in Italy, France and Slovenia. However, Estonian women had an average of 3.4 symptoms (crossing the threshold indicating depressiveness), slightly less than women in Spain and Italy and on par with French women.
J2.4.1.R
maiko.koort
2023-07-09
library(ggplot2)
library(tidyr)
library(scales)
#faili sisselugemine ja andmete formaadi korrigeerimine
J241=read.csv2("PT2-T2.4-J2.4.1.csv",header=TRUE, encoding ="UTF-8")
J241$Keskmine=as.numeric(J241$Keskmine)
J241$Usaldusintervallid=as.numeric(J241$Usaldusintervallid)
J241$Usaldusintervallid.1=as.numeric(J241$Usaldusintervallid.1)
J241$Country=as.factor(J241$Country)
J241$Country=factor(J241$Country,levels=rev(levels(J241$Country)))


#joonis
ggplot(J241,aes(x=Country,y=Keskmine,col=Sugu))+
  geom_point(cex=3)+
  geom_errorbar(aes(x=Country,ymin=Usaldusintervallid,ymax=Usaldusintervallid.1),width=0.1,linewidth=0.9)+
  theme_minimal()+
  coord_flip()+
  scale_y_continuous(limits=c(1,5))+
  scale_color_manual(values=c("#6666cc","#FF3600"))+
  theme(text = element_text(color="#668080"),axis.text=element_text(color="#668080",face=c(1,1,1,1,1,1,1,1,1,2,1,1)),legend.title=element_blank())+
  ylab("Average depressiveness (EURO-D)")
## Warning: Vectorized input to `element_text()` is not officially supported.
## ℹ Results may be unexpected or may change in future versions of ggplot2.
The average number of depressive symptoms increased with age in all the countries surveyed. For men aged 85 years and older, there were no significant differences between countries in the number of symptoms. While Estonian women crossed the threshold indicating depressiveness, or reached the average level of three symptoms, in their mid-60s, Estonian men arrived at the same level only in their 80s (Figure 2.4.2).
J2.4.2.R
maiko.koort
2023-07-09
library(ggplot2)
library(tidyr)
library(scales)
#faili sisselugemine ja andmete formaadi korrigeerimine
J242=read.csv2("PT2-T2.4-J2.4.2.csv",header=TRUE, encoding ="UTF-8")
J242$Keskmine=as.numeric(J242$Keskmine)
J242$Usaldusintervallid=as.numeric(J242$Usaldusintervallid)
J242$Usaldusintervallid.1=as.numeric(J242$Usaldusintervallid.1)
names(J242)[1]="Birth_year"

#joonis
ggplot(J242,aes(x=Birth_year,y=Keskmine,col=Sugu))+
  geom_point(position=position_dodge(0.2),cex=3)+
  geom_errorbar(aes(x=Birth_year,ymin=Usaldusintervallid,ymax=Usaldusintervallid.1),width=0.2,linewidth=0.9,position=position_dodge(0.2))+
  theme_minimal()+
  scale_color_manual(values=c("#6666cc","#FF3600"))+
  theme(text = element_text(color="#668080"),axis.text=element_text(color="#668080"),legend.title=element_blank())+
  ylab("Average depressiveness (EURO-D)")
The main lifestyle factors we have considered are the frequency of consuming various nutrients, the frequency of moderate and intense physical activity, the presence of sleep disorders, smoking (either currently or in the past) and the frequency of consuming large amounts of alcohol. The main sociodemographic variables for which we adjust the results of our regression models are age, birth year, country of birth (born in Estonia or elsewhere), place of residence (rural or urban area), marital status (married/cohabiting, divorced/separated, single, widowed), number of children, number of years spent in education and employment status (at home / ill, retired, working). We also adjusted our models for previous depressive symptoms, which describe the health status (EURO-D in 2011), the level of health-related activity limitations (severe, moderate, no limitations) and body mass index. Childhood home conditions were taken into account by adjusting the models for three variables, which describe the living conditions (the degree of crowding in the childhood home, i.e. the number of rooms per person), economic conditions (estimation of the economic situation of the childhood family) and the health status (self-reported childhood health) experienced in childhood.
The results of the final regression models adjusted for all variables on the relationship between lifestyle and mental health in men and women are listed in Figure 2.4.3. Although the associations expressed in these figures were generally few or weak, they showed that depressive symptoms were significantly more frequent in men and women who experienced sleep disorders or consumed alcohol either with unknown frequency or occasionally (1–3 times a month, compared to not once during the past three months). Since sleep disorders are one of the main symptoms indicating depressiveness, it was to be expected that the adjusted variables in our analysis did not eliminate this association. The results for alcohol consumption may initially seem perplexing. However, they are explained by the fact that those who rarely or never drink alcohol include more people with chronic health conditions or activity limitations. Thus, their existing impaired health status is the underlying condition for their abstinence from alcohol as well as their poorer mental health (Abuladze et al. 2020).
In the case of women, sociodemographic and economic variables (except marital status and number of children) explained some of the differences in depressive symptoms in sleep disorders, alcohol consumption and moderate physical activity; however, health variables explained the largest number of the differences (Table 2.4.1). This was most evident for moderate physical activity, where significant differences in the odds of depressiveness disappeared (Model 6, Table 2.4.1). Of the childhood factors, the economic conditions and the self-assessment of childhood health explained some of the differences.
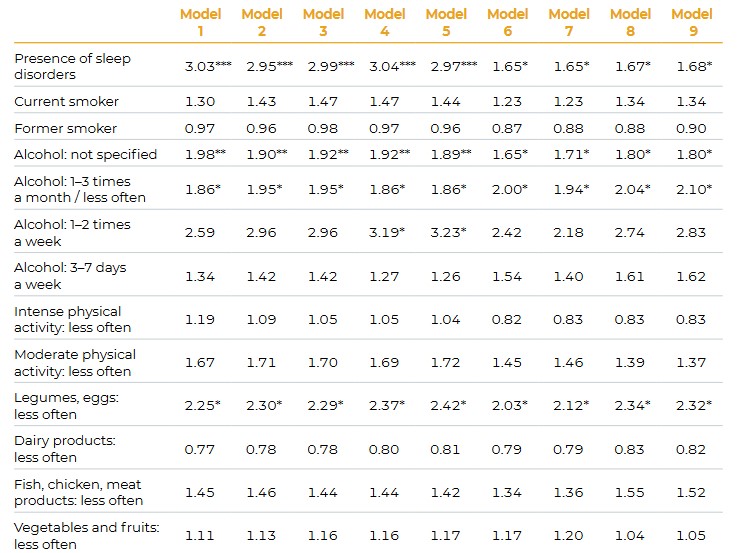
Men who ate protein-rich foods less than three days a week had twice the odds of depressiveness as those with a daily protein intake (Table 2.4.2). After adjusting the model for health variables, however, the significance of this variable disappeared, indicating that health problems can affect the frequency of consuming the corresponding nutrients (Model 6, Table 2.4.2). However, when adjusted for childhood conditions, this variable once again assumed significance, suggesting the presence of some adverse association with nutrient intake (Models 8 and 9, Table 2.4.2).
While health status best explained the differences in the odds of depressiveness in both men and women, adjusting the model for childhood conditions decreased differences in the odds of depressiveness only in women. Childhood conditions, especially economic status and self-reported health, explain differences in mental health among women. Thus, among women, the inequality experienced during childhood carries over into later life, amplifying somewhat the negative relationship between lifestyle and mental health in old age.
Therefore, the presence of sleep disorders and differences in the frequency of alcohol consumption most clearly predicted depressiveness in older men and women in Estonia. In men, however, the role of a protein-rich diet in the onset of depressiveness was also found to be important. Other lifestyle factors, such as consumption of various nutrients, physical activity and smoking, were not good predictors of experiencing depressiveness in older age.
J2.4.3.R
maiko.koort
2023-07-09
library(ggplot2)
library(tidyr)
library(scales)

#faili sisselugemine ja andmete formaadi korrigeerimine
J243=read.csv2("PT2-T2.4-J2.4.3.csv",header=TRUE, encoding ="UTF-8")
J243$OR=as.numeric(J243$OR)
J243$Tunnus=sub("_"," ",J243$Tunnus)
J243$Tunnus=sub("_"," ",J243$Tunnus)
J243$Väärtus=sub("_"," ",J243$Väärtus)
J243$Väärtus=sub("_"," ",J243$Väärtus)
J243$usaldusintervall=as.numeric(J243$usaldusintervall)
J243$usaldusintervall.1=as.numeric(J243$usaldusintervall.1)
J243$Väärtus=as.factor(J243$Väärtus)
J243$Tunnus=as.factor(J243$Tunnus)
J243$Tunnus=factor(J243$Tunnus,levels(J243$Tunnus)[order(c(9,5,4,3,6,2,8,7,1))])
J243$Väärtus=factor(J243$Väärtus,levels(J243$Väärtus)[order(c(2,3,1,11,5,6,7,8,9,12,4,10))])
J243$Sugu="Men"

J244=read.csv2("PT2-T2.4-J2.4.4.csv",header=TRUE, encoding ="UTF-8")
J244$OR=as.numeric(J244$OR)
J244$usaldusintervall=as.numeric(J244$usaldusintervall)
J244$usaldusintervall.1=as.numeric(J244$usaldusintervall.1)
J244$Väärtus=as.factor(J244$Väärtus)
J244$Tunnus=as.factor(J244$Tunnus)
J244$Tunnus=factor(J244$Tunnus,levels(J244$Tunnus)[order(c(9,5,4,3,6,2,8,7,1))])
J244$Väärtus=factor(J244$Väärtus,levels(J244$Väärtus)[order(c(2,3,1,11,5,6,7,8,9,12,4,10))])
J244$Sugu="Women"
J243=rbind(J243,J244)
J243$OR=as.numeric(J243$OR)


#joonis
ggplot(J243)+
  theme_minimal()+
  geom_abline(aes(slope=0,intercept=1),linetype="dashed")+
  geom_errorbar(aes(x=Väärtus,ymin=usaldusintervall,ymax=usaldusintervall.1,col=Sugu),width=0.2)+
  geom_point(aes(x=Väärtus,y=OR,col=Sugu),cex=2)+
  scale_color_manual(values=c("#6666cc","#FF3600"))+
  theme(text = element_text(color="#668080"),axis.text=element_text(color="#668080"))+
  facet_grid(Tunnus~Sugu,scales="free_y", space="free",labeller = label_wrap_gen(5))+
  theme(legend.position = "none")+
  coord_flip()+
  xlab("")+
  ylab("")+
  theme(strip.text.y = element_text(angle = 360,color="#668080"),strip.text.x = element_text(face = "bold",size=10,color="#668080"))
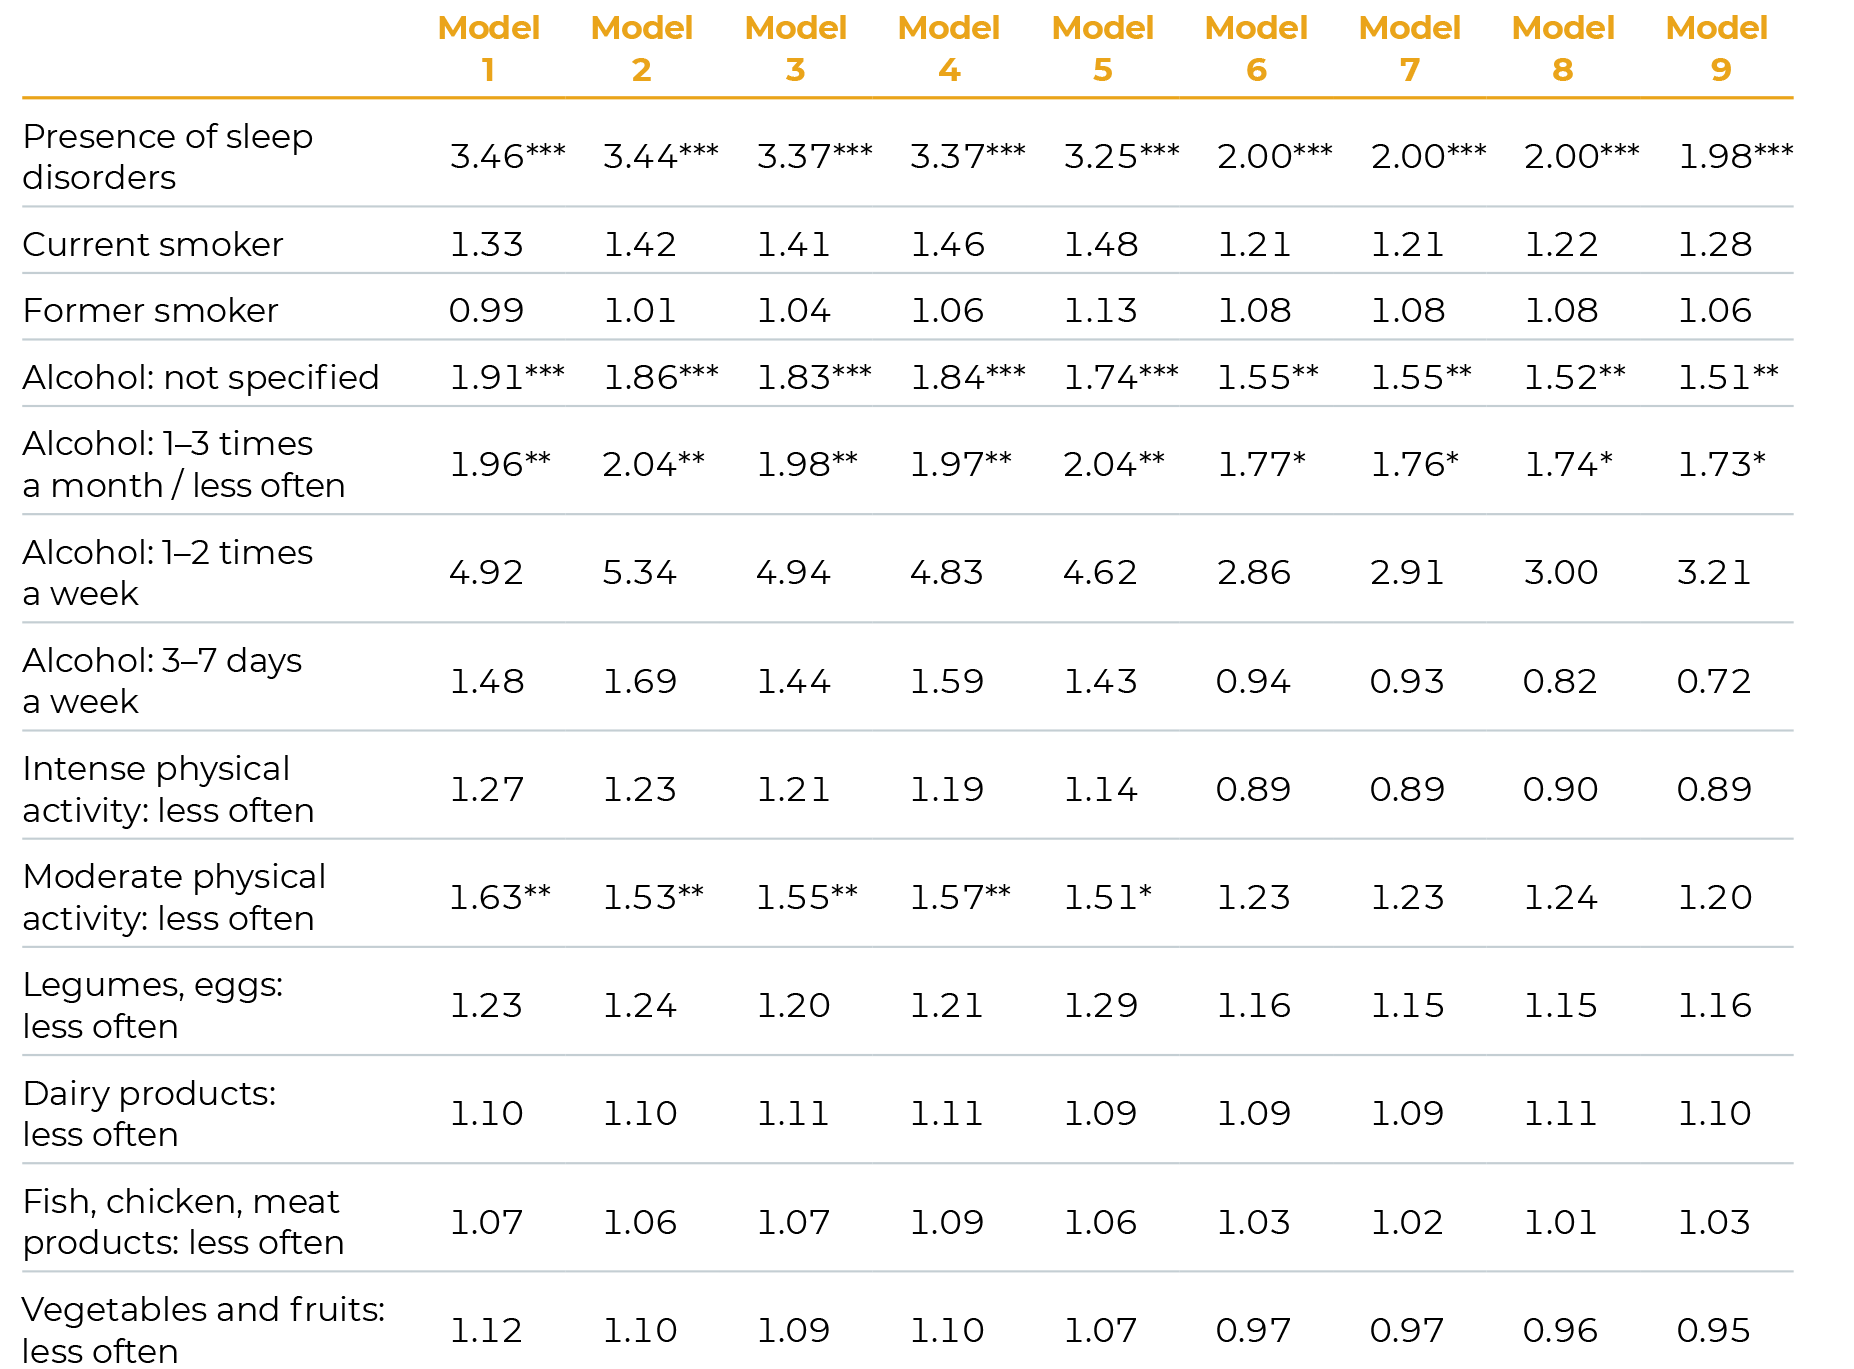
Reference groups: no sleep disorders; never smoked; no alcohol consumption in the past three months; daily intense physical activity; daily moderate physical activity; daily consumption of legumes, eggs, dairy products, fish, chicken, meat products and vegetables and fruits.
The order of adjustment for variables in the models: Model 1: lifestyle factors; Model 2: + age, birth cohort; Model 3: + national origin, place of residence; Model 4: + marital status, number of children; Model 5: + education, employment status: Model 6: + depressiveness, activity limitations, BMI; Model 7: + degree of crowdedness of childhood home; Model 8: + economic status in childhood; Model 9: + health status in childhood.
Notes:
Statistical significance: *** p < 0,001; ** p < 0,01; *p < 0,05; p >= 0,05p
Reference groups: no sleep disorders; never smoked; no alcohol consumption in the last 3 months; daily intense physical activity; daily moderate physical activity; daily consumption of legumes, eggs, dairy products, fish, chicken, meat products and vegetables and fruits.
The order of adjustment for variables in the models: Model 1: lifestyle factors; Model 2: + age, birth cohort; Model 3: + national origin, place of residence; Model 4: + marital status, number of children; Model 5: + education, employment status: Model 6: + depressiveness, activity limitations, BMI; Model 7: + degree of crowdedness of childhood home; Model 8: + economic status in childhood; Model 9: + health status in childhood.
Summary
Based on a self-reported indicator from 2013, the average number of depressive symptoms among people aged 65 and older in Estonia was relatively high compared to the rest of Europe. Men’s relative position was worse than in other countries, although women had a higher average number of depressive symptoms than men. At an even older age – 85 years and older – men in all countries reported having similar depressive tendencies, suggesting the workings of more universal factors contributing to depressiveness in men at this age. Just as depressiveness was generally more common among women than men, women also developed a depressive state more early in life: Estonian women reached the threshold indicating depressiveness in their 60s, whereas men only followed in their 80s.
After adjustment for all variables, Estonian men and women aged 65 and older were significantly more likely to experience depressiveness if they had sleep disorders or consumed alcohol infrequently (compared to non-drinkers). The relationship between sleep disorders and mental health is well-known: sleep disorders are considered one of the main symptoms of depression and depressiveness. However, our analysis indicated that the relationship between sleep disorders and depressiveness in older people can be attributed mainly to health-related activity limitations and past depressive symptoms. The important role of activity limitations is consistent with the theoretical framework according to which the functioning of society (both social and institutional) does not meet people’s health needs (Verbrugge and Jette 1994). The relevance of past depressive symptoms, on the other hand, indicates the persistence of mental health problems that neither the healthcare sector nor the social environment have managed to prevent.
herefore, ways of improving mental health in older people should be based on a complex and comprehensive approach, taking into account the need to shape both the social and physical environment and advance general wellbeing.
Older people who abstain from alcohol often have pre-existing health conditions, while those who consume alcohol are healthier both mentally and physically (Abuladze et al. 2020). In women, health factors also accounted for differences in experiencing depressiveness in the case of moderate physical activity. Possibly in contrast to other life stages and common recommendations, we found that physical activity in older age was highly dependent on existing health status.
Therefore, by eradicating social and physical barriers that prevent people with various health conditions from participating in social life (Verbrugge ans Jette 1994), we could see the positive effects of physical activity on alleviating or preventing depressive symptoms in older Estonian women.
In men, too, the differences in depressive symptoms were attributed to the characteristics of their current health status; however, it was primarily through the general quality of their diet. Therefore, the influence of dietary choice on the onset of depressiveness was actualised through recent activity limitations and the previous experience of depressiveness: in the presence of these health problems, men neglected to consume certain nutrients, which in turn possibly had an adverse effect on their mental health. It is interesting to note that unlike in women, in men childhood conditions did not account for the differences in developing depressive symptoms later in life.
While experiences from the earlier stages of life were somewhat associated with mental health in older age, recent or current health status had the strongest influence on the association between lifestyle factors and mental health. The negative association that socioeconomic and health conditions in childhood had with sleep disorders – and thereby also with mental health – in old age was reduced by the socioeconomic conditions in later life. Yet the buffering was partial: the relationship between inequality experienced in childhood and health still carried over into the last decades of the life course. In line with previous findings, this was evident in women (van de Straat et al. 2020).
Although health-supporting habits and attitudes related to diet or physical activity may also persist from childhood (Hirvensalo and Lintunen 2011; Devine 2005), this association did not clearly emerge among Estonia’s older people. By contrast, addressing more recent health-related activity limitations and mental health problems could improve physical activity in women and nutrition in men, thereby reducing depressive symptoms in older age.
Mental health outcomes in older age could be improved by removing social and physical barriers that restrict participation in society, preventing and alleviating depressive symptoms in older people in a timely manner,
and improving the childhood conditions of future generations. Even though depressive symptoms are more prevalent in old age than earlier in life, mitigating and preventing them in Estonia should be done with more consideration of the socioeconomic and health-related inequality among older people. This means that mental health supervision and health services should be better adjusted to the backgrounds of different birth generations, and people with a more vulnerable life course should be targeted specifically.
Abuladze, L., Opikova, G., Lang, K. (2020). Factors associated with incidence of depressiveness among the middle-aged and older Estonian population. SAGE Open Medicine, 8, 1−12. DOI: 10.1177/2050312120974167.
Devine, C. J. (2005). A Life Course Perspective: Understanding Food Choices in Time, Social Location, and History. Journal of Nutrition Education and Behavior, Vol. 37(3), 121–128. https://doi.org/10.1016/S1499-4046(06)60266-2.
Elder, G. H., Johnson, M. K., Crosnoe, R. (2003). The emergence and development of life course theory. In Handbook of the life course (pp. 3-19). Springer, Boston, MA.
Guerra, M., Ferri, C., Llibre, J., Prina, A. M., Prince, M. (2015). Psychometric properties of EURO-D, a geriatric depression scale: A cross-cultural validation study. BMC Psychiatry, 15(1). doi:10.1186/s12888-015-0390-4
Hirvensalo, M., Lintunen, T. (2011). Life-course perspective for physical activity and sports participation. Eur Rev Aging Phys Act 8, 13–22. https://doi.org/10.1007/s11556-010-0076-3.
Laidra K. (2016). Vaimne ja kognitiivne tervis. In: Sakkeus L, Leppik L. Pilk hallile alale. SHARE Eesti uuringu esimene ülevaade ja soovitused eakate poliitika kujundamiseks. Tallinn: Tallinna Ülikool, 73–96.
Pearlin, L. I., Schieman, S., Fazio, E. M, Meersma, S. C. (2005). Stress, Health, and the Life Course: Some Conceptual Perspectives. Journal of Health and Social Behavior, 46 (June): 205–219.
van de Straat, V., Cheval, B., Schmidt, R. E., Sieber, S., Courvoisier, D., Kliegel, M., Burton-Jeangros, C., Cullati, S., Bracke, P. (2020). Early predictors of impaired sleep: a study on life course socioeconomic conditions and sleeping problems in older adults. Aging & Mental Health, 24:2, 322–332, DOI: 10.1080/13607863.2018.1534078.
Verbrugge, L. M., Jette, A. M. (1994). The disablement process. Social Science and Medicine, 38(1), l-14.
WHO (2014). World Health Organization and Calouste Gulbenkian Foundation. Social determinants of mental health. Geneva, World Health Organization. https://apps.who.int/iris/bitstream/handle/10665/112828/9789?sequence=1.
WHO (2017). World Health Organisation. Mental health of older adults: fact sheet. http://www.who.int/mediacentre/factsheets/fs381/en/.