Annoyance due to air and noise pollution
The physical living environment shapes our well-being and life satisfaction. The importance of our living environment has been little recognised so far, and we tend to take it for granted. For example, the availability of clean air and drinking water is required for everyday well-being and health. We only pay attention to these foundations when something is very wrong – when the city air suffocates us or when the noise does not let us sleep. Both air and noise pollution cause annoyance, which can affect mental health. This article outlines the effects of air and noise pollution on mental health, the extent of this problem in Estonia, the dynamics of the problem, and the possibilities to reduce disturbing environmental factors.
Annoyance is a human physiological, emotional, cognitive, and behavioural response to stressors, including air pollution and noise. The symptoms of annoyance are similar to those of psychological stress: dissatisfaction, irritability, fatigue, pain from tension and problems with sleep. For example, residents in areas with more pollution are more likely to suffer from mental disorders, including anxiety and depression. (Marques and Lima 2011). Studies on environmental stress show that exposure to chemical, noise or air pollution causes irritation in our smell or sound receptors, which in turn activates the autonomic nervous system, affecting our physiology and emotions. (Sucker et al. 2008). Evolutionarily, humans are programmed to recognise sounds and odours as potential sources of danger. For example, a bad odour or visible smoke signals polluted air, and certain sounds are unpleasant for us. Furthermore, when a predator roars, our blood pressure rises, heart rate increases and stress hormones are released. Historically, this has helped humans to prepare themselves in dangerous situations and make a quick escape if necessary. But being constantly on alert, for example, due to polluted air and disturbing noise, burdens the body and can, in the long term, exhaust the organism and lead to chronic illnesses.
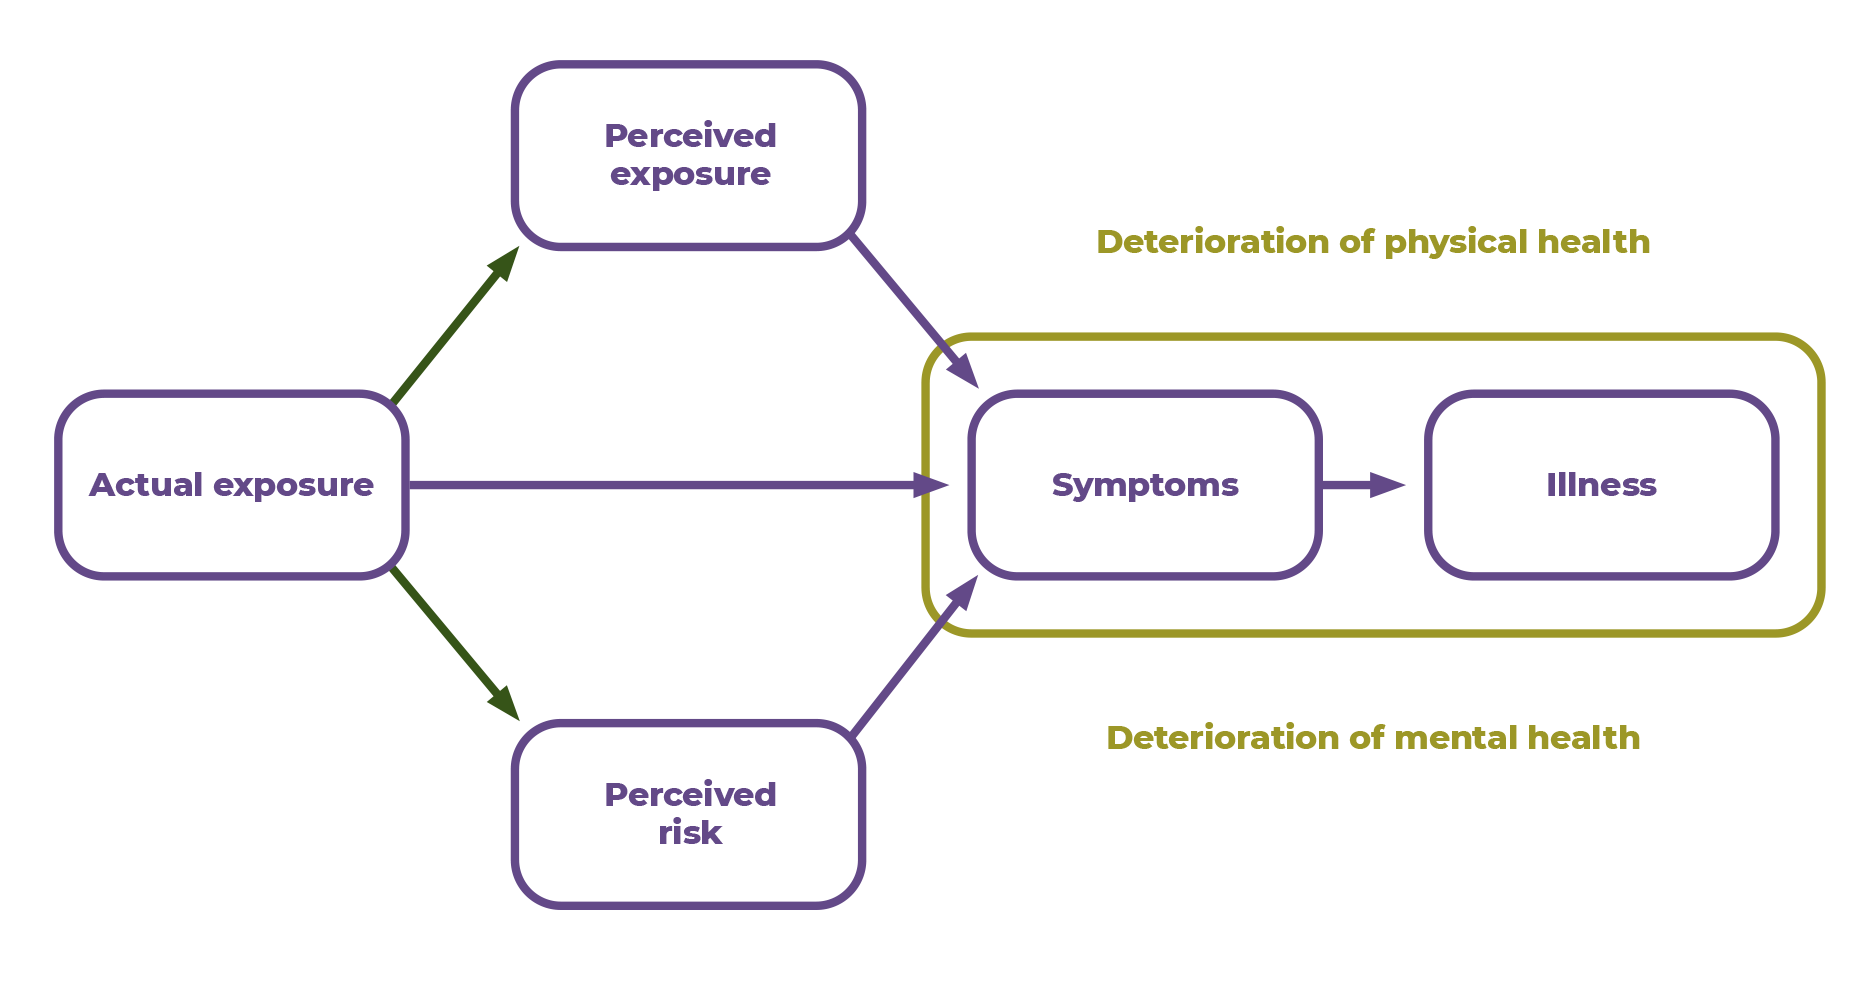
Being exposed to a hazard is not the only way of experiencing environmental health impacts; our perception of environmental factors and attitudes towards hazards can also have an effect. BBio-psycho-social studies show links between actual pollution, perceived1 pollution, perceived health risks and health symptoms (Andersson et al. 2013; Crichton and Petrie 2015).
These links are called subjective risk perception. In addition to exposure to pollution and physiological irritation, subjective risk perception and fear of the health effects of environmental factors affect people’s psychological wellbeing and health. People’s perception of pollution and risk can affect health more than actual pollution levels. For example, at lower concentrations of pollution, 2 perceived pollution and health risks predict health symptoms significantly better than actual pollution levels and exposure do.(Stenlund et al. 2009; Orru et al. 2018). For this reason, the perception of air pollution and the perceived serious health risks associated with it may have bigger effects on health than the direct physiological effects of air pollution. Figure 5.2.1 shows that some of the symptoms leading to illness are caused by direct actual exposure, while others are caused by perceived risk and exposure, which in turn are affected by actual exposure.
The following analysis combines: 1) data from the Estonian cross-sectional sociological study KesTeRisk3 läbilõikeuuringu (K. Orru et al. 2015) on the risk perceptions of 1,000 residents and people’s assessment of exposure to air pollution, and 2) modelled annual average levels of particulate matter in a person’s place of residence (K. Orru et al. 2018). The analysis examined the role of objectively measured levels of air pollution and perceived exposure to air pollution in the development of negative health effects. It was revealed that air pollution levels did not correlate with the number of symptoms and chronic diseases. Instead, health indicators are influenced by perceived exposure and health risks. This means that in environments where pollution levels are below legal limits, air pollution is a significant health risk, especially if people pay attention to it and consider it a significant health risk.
The perceived risk of air pollution varies significantly in different parts of Estonia, being highest in Ida-Virumaa. In a 2015 study of health effects in the oil shale industry, a survey of adults revealed that more than 10% of the residents of Ida-Virumaa consider air pollution unbearable (respondents were asked to assess their annoyance with air pollution on a scale of 0–10).
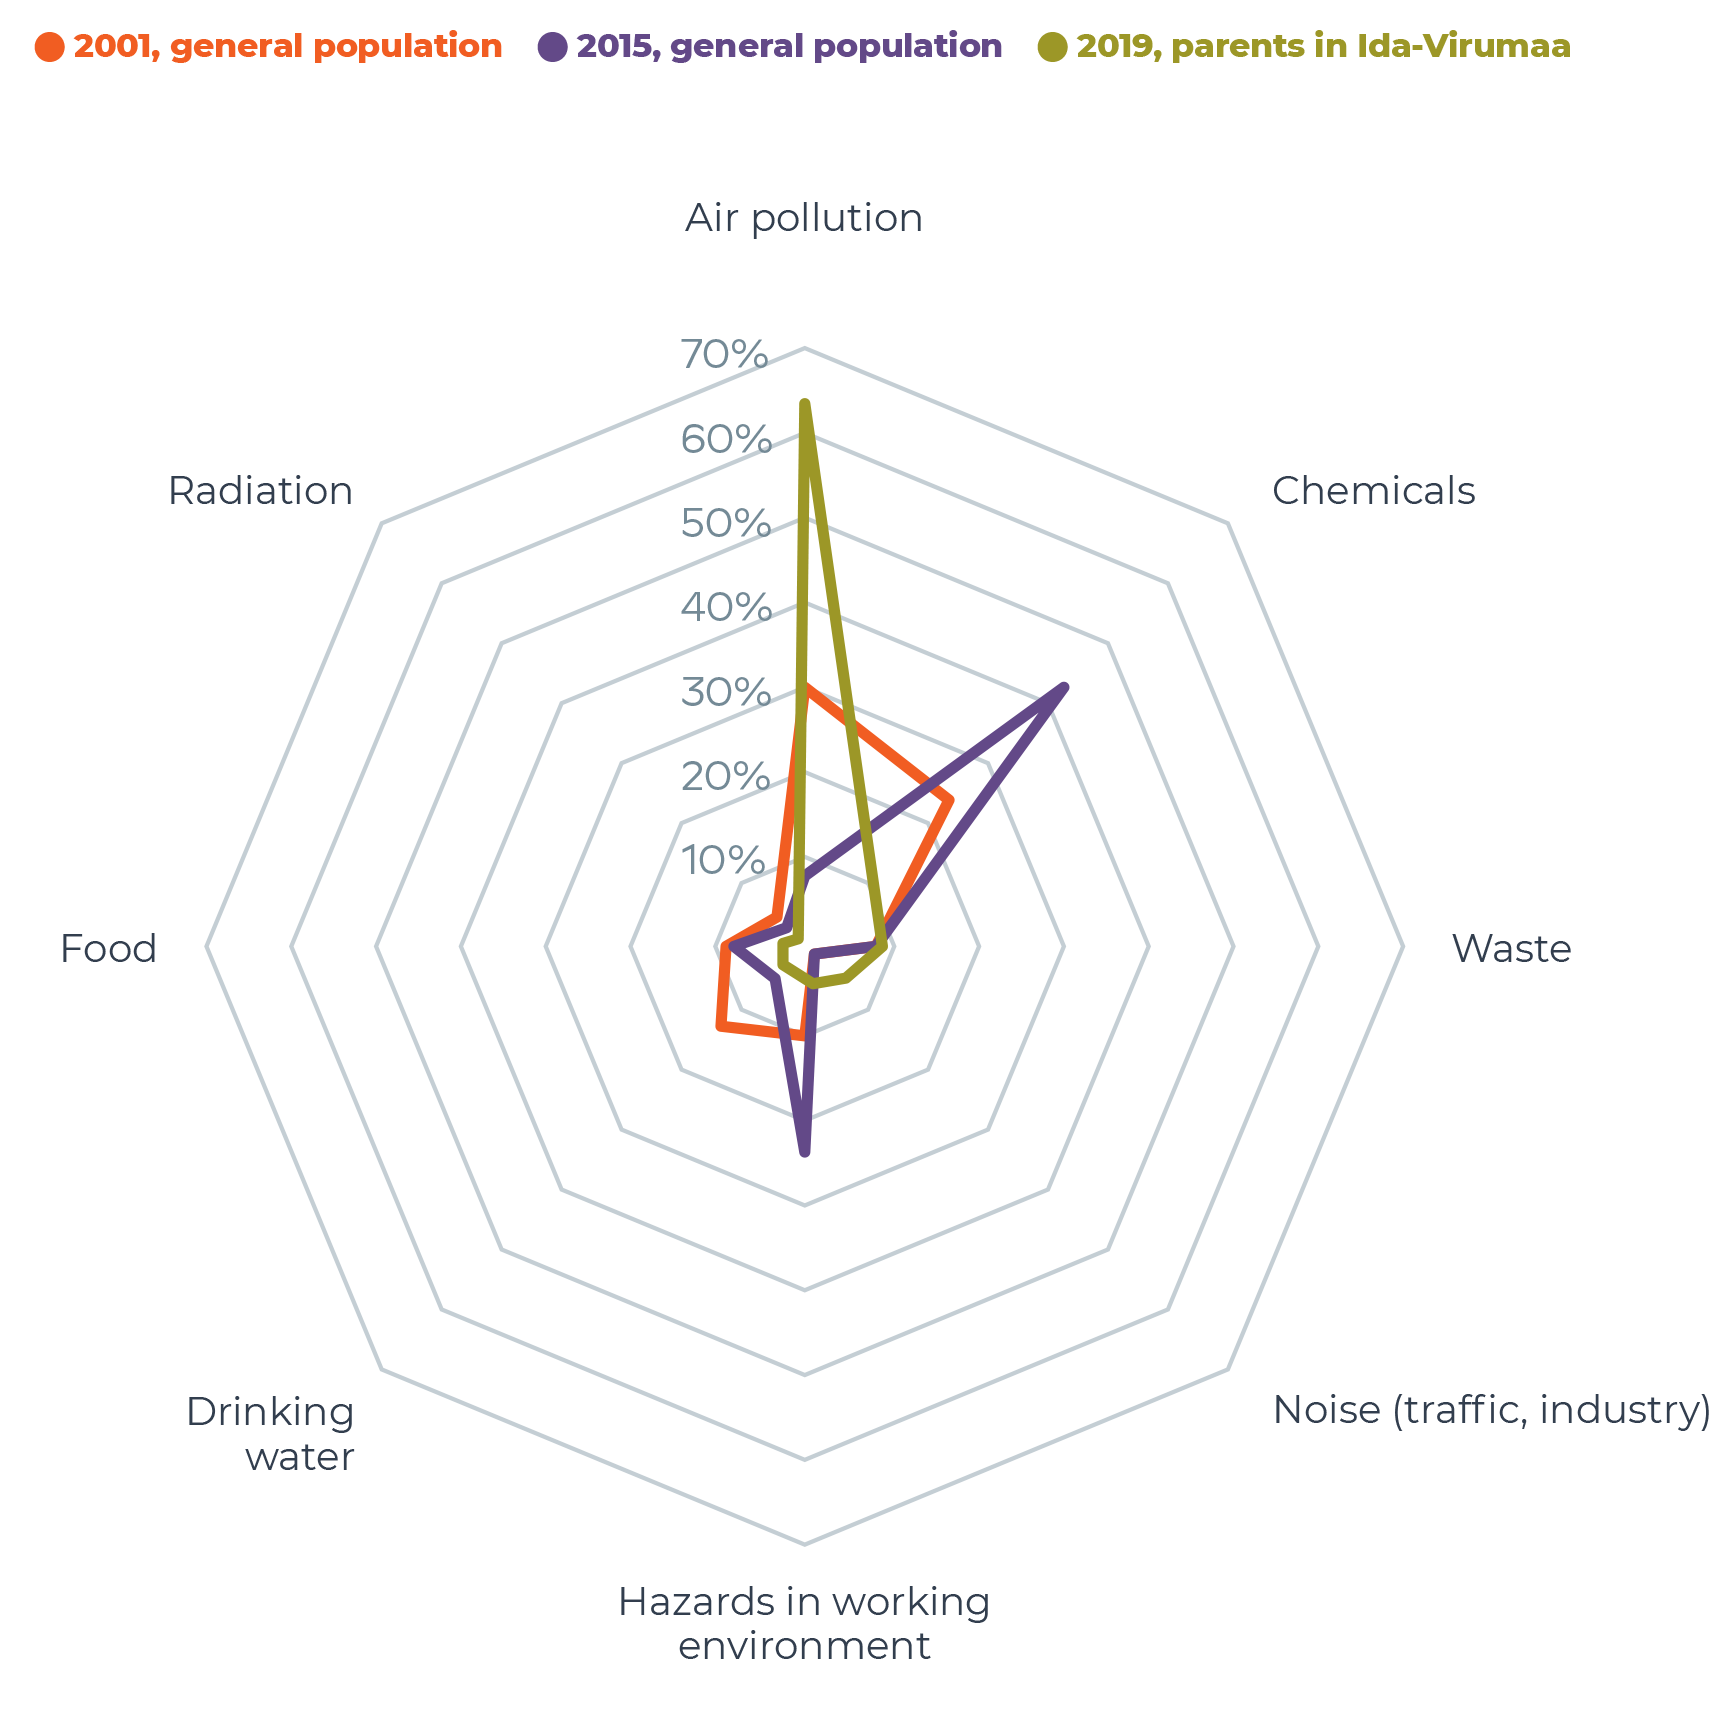
In addition, half of the respondents saw air pollution as a high or very high risk to their health, as well as to that of their family and others close to them. The importance of the health risks of air pollution shows Figure 5.2.2, the parents in Ida-Virumaa consider air pollution to be by far the most prominent among the eight mentioned environmental risk factors.
Figure 5.2.2 shows the importance of the health risks of air pollution; the parents in Ida-Virumaa consider air pollution to be by far the most prominent among the eight mentioned environmental risk factors. In the survey, the respondents had to pick the most prominent environmental factor that they thought caused illnesses.
from an unfavourable living environment in Estonia, percentage of those who named the factor (%)
Environmental sensitivity describes the feelings of a person who is particularly sensitive to annoyance caused by environmental factors. People’s physiological and psychological state (including attitudes) amplifies their response to an environmental factor: noise, air pollution, unpleasant odours and electromagnetic fields. For example, people sensitive to noise pay more attention to noise, perceive noise as more dangerous, and react more intensely to noise compared to those who are not sensitive to noise. Environmental sensitivity is usually evaluated using questionnaires.
UStudies of the associations between objective levels of noise (e.g. measured levels of traffic noise) and self-rated health show that the higher the level of noise, the stronger the association with anxiety and insomnia among people sensitive to noise(WHO 2018). Regardless of the levels of noise, exposure to traffic noise can cause anxiety and sleep disorders in people sensitive to noise. High sensitivity to noise is associated with psychological problems such as depression and anxiety.
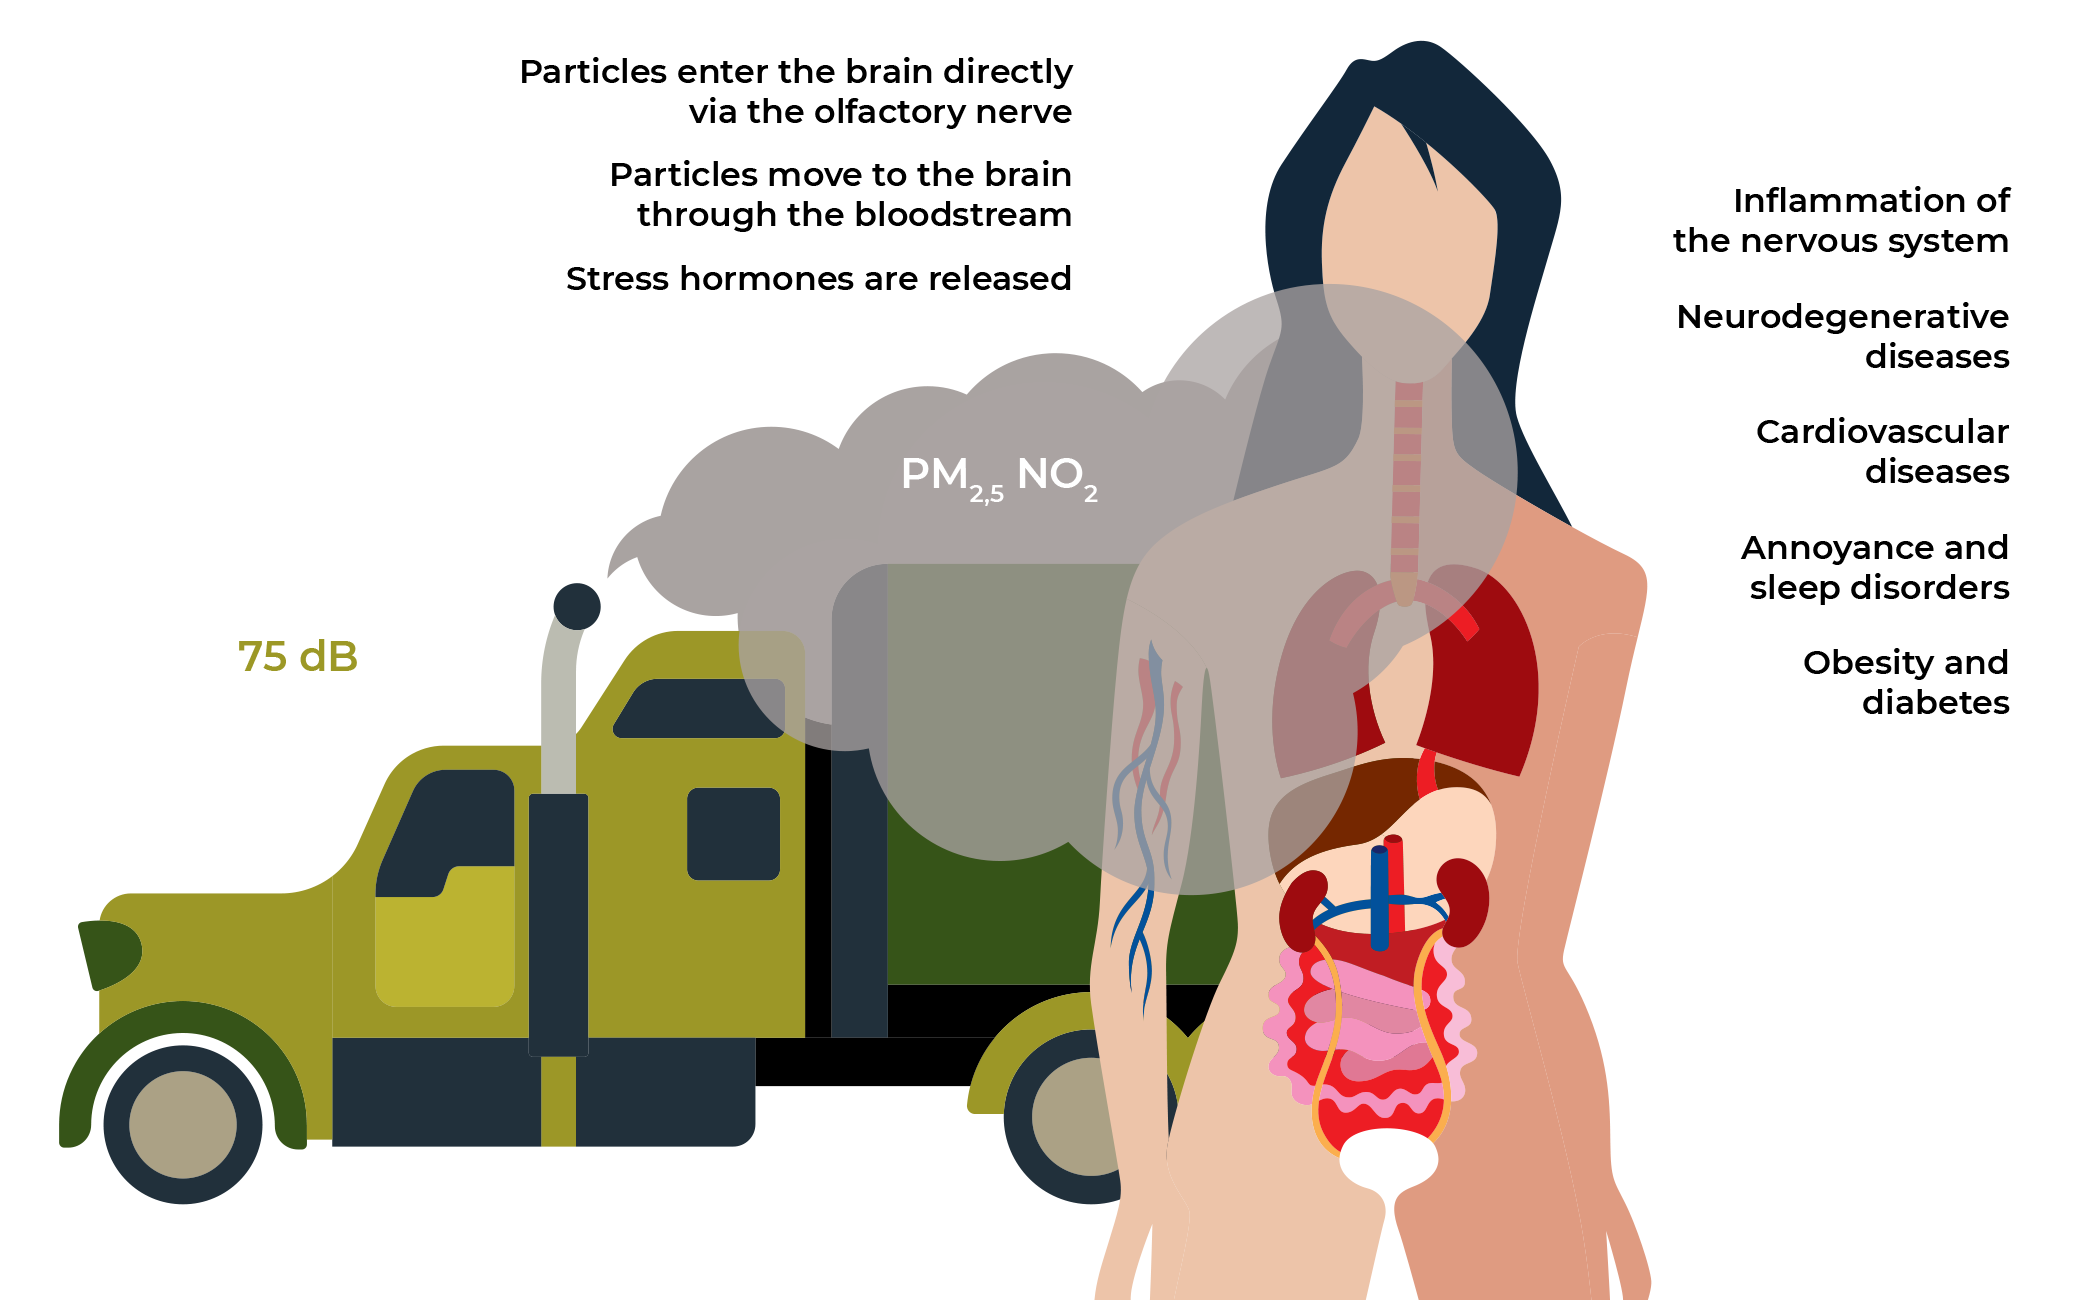
In addition to causing annoyance, as shown in Figure 5.2.1, air pollution has direct effects on mental health through neurophysiological mechanisms (Figure 5.2.3). PM2,54 nanoparticles in air pollution (e.g. particles approximately 10 to 20 nanometres in size in vehicle exhaust emissions) are small enough to reach the brain via the bloodstream or the olfactory nerve. The exact modes of action are still being studied (the most likely effect is the inflammation of the nervous system), but existing research suggests that exposure to PM2,5 increases the incidence of neurodegenerative diseases (Parkinson’s and Alzheimer’s) and is associated with an increased risk of dementia and suicide. PStudies have also suggested that air pollution increases the risk of depression and anxiety and reduces intelligence and learning ability.
Similarly, exposure to traffic noise can affect mental health, cause psychological problems and impair cognitive abilities. Biological reactions in the human body happen primarily through the nervous system or endocrine system and stress hormones (adrenaline, noradrenaline and cortisol). This can cause physiological stress, concentration difficulties, and sleep and metabolic disorders, which in turn can lead to more serious conditions (hypertension, ischaemic heart disease, stroke, obesity and diabetes).
and the neurophysiological effects in the body after exposure
In Estonia, air pollution is measured in the major cities and industrial areas, and background pollution is measured in rural areas. ÕAir quality data can be seen in real time at www.ohuseire.ee. Coarse matter (PM10)and fine particles (PM2,5) have the greatest health impact. The main sources are traffic (exhaust gas and particles from the wear and tear of road surface and tyres), domestic heating (mainly from stove heating) and industrial pollution (particularly in Ida-Virumaa). Nitrogen dioxide (NO2) is also considered an important indicator of traffic pollution.
We will take a look at the dynamics of air quality in four major Estonian cities since 2008, when pollutant monitoring began in all of them
Ambient air monitoring reveals that in recent years, Estonia has met the main criteria of pollution levels set by the relevant European Union: either the pollution levels have remained below the limits or the frequency of exceeding those limits has remained within the permitted parameters. (According to the EU regulation, the average daily limit of PM10 may be exceeded 35 times a year and the average hourly levels of NO2 t18 times a year.). There is a downward trend in the levels of both PM10 kui NO2 ndicating improved air quality (Figure 5.2.4). E But is the air quality good enough not to affect physical and mental health?
Recently, the World Health Organization (WHO) released new air quality guidelines: the annual average level of PM2,5 must be less than < 5 µg/m3, the annual average level of PM10 < 15 µg/m3 and the annual average levels of NO2 ess than 10 < 10 µg/m3. Such air quality is achieved in the rural areas and many suburban areas in Estonia, but not in the centre of Tallinn, the Karlova district in Tartu or the industrial areas of Ida-Virumaa, according to the data from the measuring stations in these places. European Environment Agency’s analyses paint a somewhat distorted image of Estonian air quality. For many years, only the data from the Õismäe measuring station in Tallinn, which has the lowest particulate matter levels out of all the city’s measuring stations, have been used in this study (Figure 5.2.4). In fact, Estonia’s air is not the cleanest in Europe or the world, as stated in the media, but it is among the cleanest in Northern Europe.
J5.2.4.R
maiko.koort
2023-07-24
library(ggplot2)
library(tidyr)

#faili sisselugemine ja andmete formaadi korrigeerimine
J524=read.csv2("PT5-T5.2-J5.2.4.csv",header=TRUE, encoding ="UTF-8")
names(J524)=gsub("X", " ",  names(J524))
J524=pivot_longer(J524,2:15)
J524$value=as.numeric(J524$value)
J524$name=as.numeric(J524$name)
J524$Saaste=as.factor(J524$Saaste)
J524$Saaste=factor(J524$Saaste,levels=rev(levels(J524$Saaste)))
J524$Piirkond=as.factor(J524$Piirkond)
J524$Piirkond=factor(J524$Piirkond, levels(J524$Piirkond)[order(c(3,4,1,2,5))])


#joonis
ggplot(J524)+
  geom_line(aes(x=name,y=value,col=Piirkond),linewidth=1.5)+
  facet_wrap(~Saaste,nrow=2)+
  theme_minimal()+
  scale_color_manual(values=c("#4026cc","#8fa300","#668080","#f09d00","#ff3600"))+
  theme(text = element_text(color="#668080"),axis.text=element_text(color="#668080"))+
  theme(strip.text.x = element_text(face = "bold",color="#668080"))+
  scale_x_continuous(breaks=unique(J524$name))+
  xlab("")+
  ylab("%")+
  theme(legend.title=element_blank(), legend.position = "top",)
Health risk evaluations and population-based epidemiological studies have shown the impact of air quality on health. According to a recent study, air pollution from atmospheric particulate matter and nitrogen dioxide caused an estimated 1,179 premature deaths in Estonia in 2020, which is 29% less than a decade earlier (H. Orru et al. 2022).The impact of ground-level ozone caused another 134 premature deaths (H. Orru et al. 2016). Population-based epidemiological studies in Tartu (Pindus et al. 2016) and Ida-Virumaa (Idavain et al. 2019) have revealed that air pollution has a clear effect on both respiratory and cardiovascular diseases even at the previously described low levels of air pollution.
Epidemiological studies look at the occurrence of diseases and other health-related phenomena, including deaths, in a certain population group or the entire population and connect these phenomena to determinants and risk factors, which include environmental pollution. A study by Pindus et al. (2016)) revealed that heart diseases occurred more frequently in residents who were exposed to higher levels of PM2,5 while the average exposure was only slightly above the norm (5,6 µg/m3). The study by Idavain et al. (2019) showed that third- and fourth-grade students (N = 1,326) in Ida-Virumaa who were exposed to benzene air pollution had more cases of chronic rhinitis, asthma, coughs and respiratory tract inflammation.
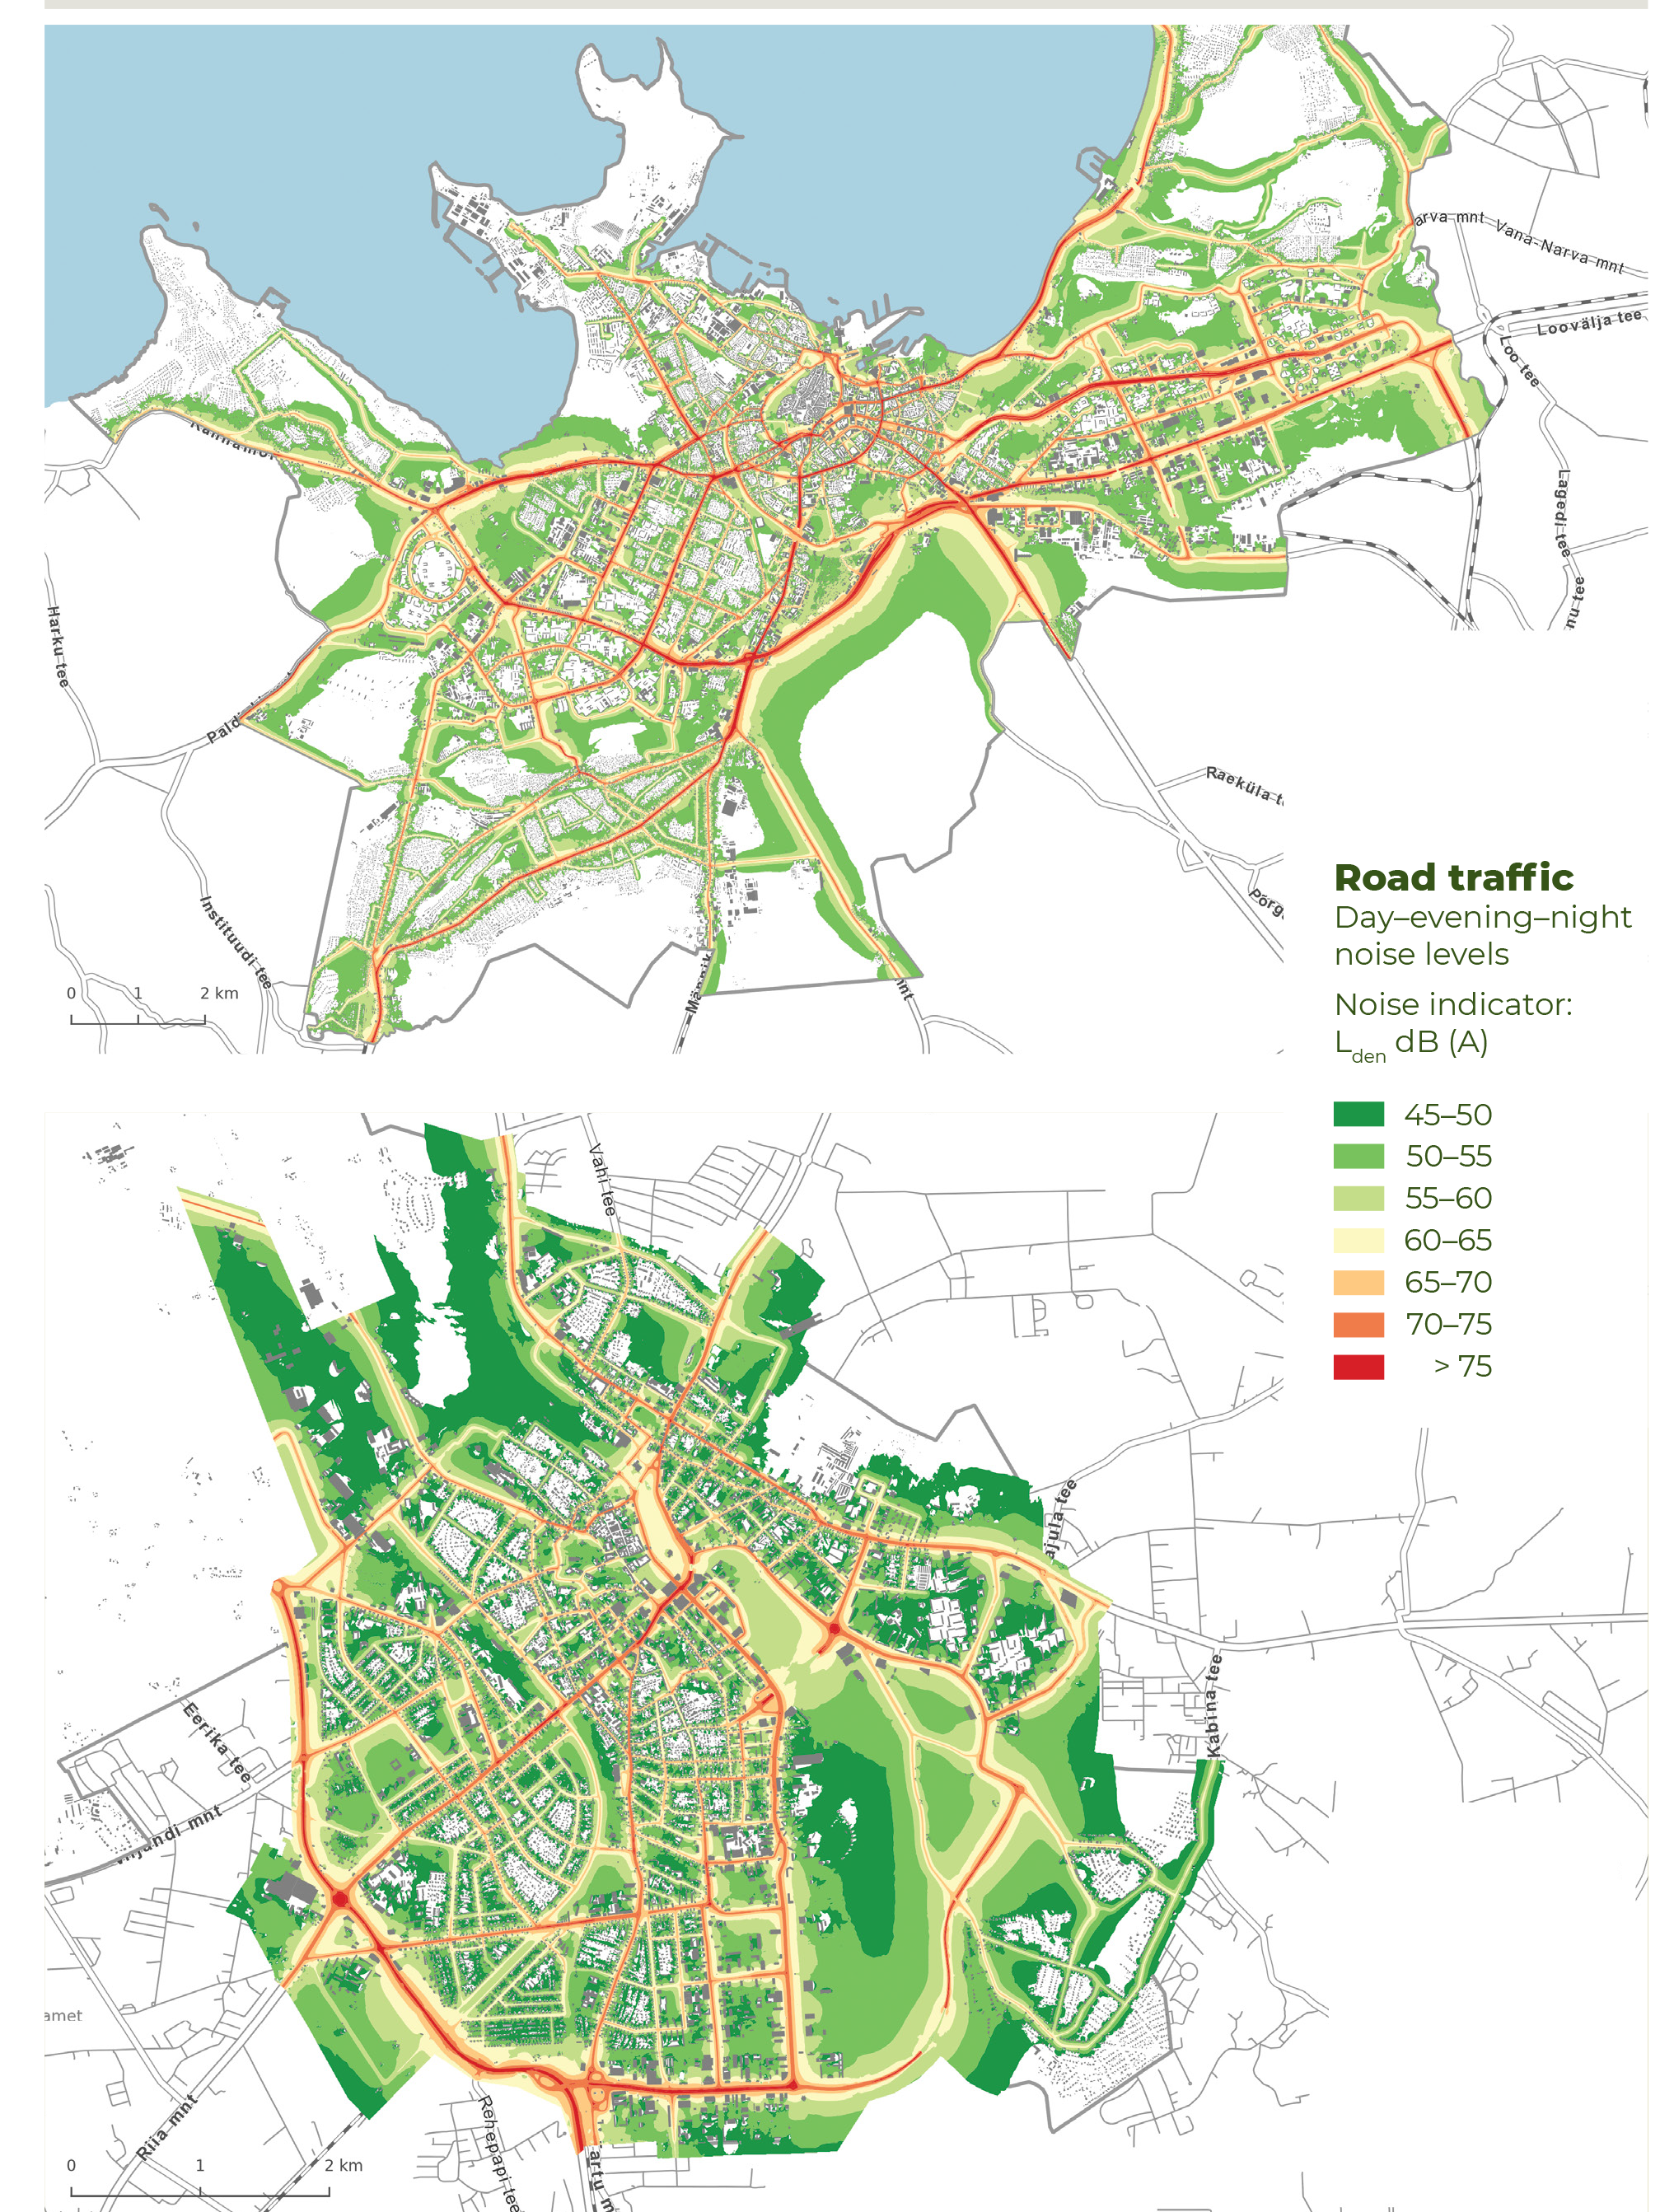
As a member of the European Union, Estonia is required to submit strategic noise maps for its major cities every five years to evaluate the noise situation. Action plans to reduce ambient noise are drawn up based on these strategic maps. The most recent strategic noise maps are from 2017 and provide data on Tallinn and Tartu in 2015 (Figure 5.2.5). Based on these, 61% of the residents of Tallinn and 60% of Tartu are exposed to a high level of road traffic noise (Ldén5 ≥ 55 dB). A total of 3,300 residents in Tallinn and Tartu are exposed to the high noise level of railway traffic (Ldén ≥ 55 dB) and 3,100 residents in Tallinn are exposed to aircraft noise (Ldén5 ≥ 55 dB).Compared to the maps of 2012, the number of people exposed to high levels of noise has decreased in Tallinn and increased in Tartu based on the 2015 data. It is important to note that this is a logarithmic scale. Thus a difference of 3 decibels means double the noise level, a difference of 10 decibels is about 10 times the noise level, and a difference of 20 decibels is more than 100 times the noise level.
The health effects of road, rail and aircraft noise in the cities of Tallinn and Tartu and near the main roads were evaluated in 2020 (Veber et al. 2021), applying the common methods for assessing harmful effects established by European Union Directive 2020/367, which uses modelled noise levels and exposure-response relations found in previous epidemiological studies. (Veber et al. 2021). The survey revealed that 12% of the residents of Tallinn and 9% of Tartu experience high annoyance due to road traffic noise. Approximately 3% of residents in both cities experience high sleep disturbance due to road traffic noise.
Since relatively few people are exposed to train and aircraft noise, the resulting annoyance and sleep disorders are also less frequent – less than 1% of the population of Tallinn and Tartu is affected. In addition to annoyance and sleep disturbance, an estimated nearly 150 cases of ischaemic heart disease and a similar number of stroke cases caused by road traffic noise are diagnosed every year (Veber et al. 2021). This clearly indicates that traffic noise is a significant problem in our cities and around the main roads.
Air pollution and life satisfaction
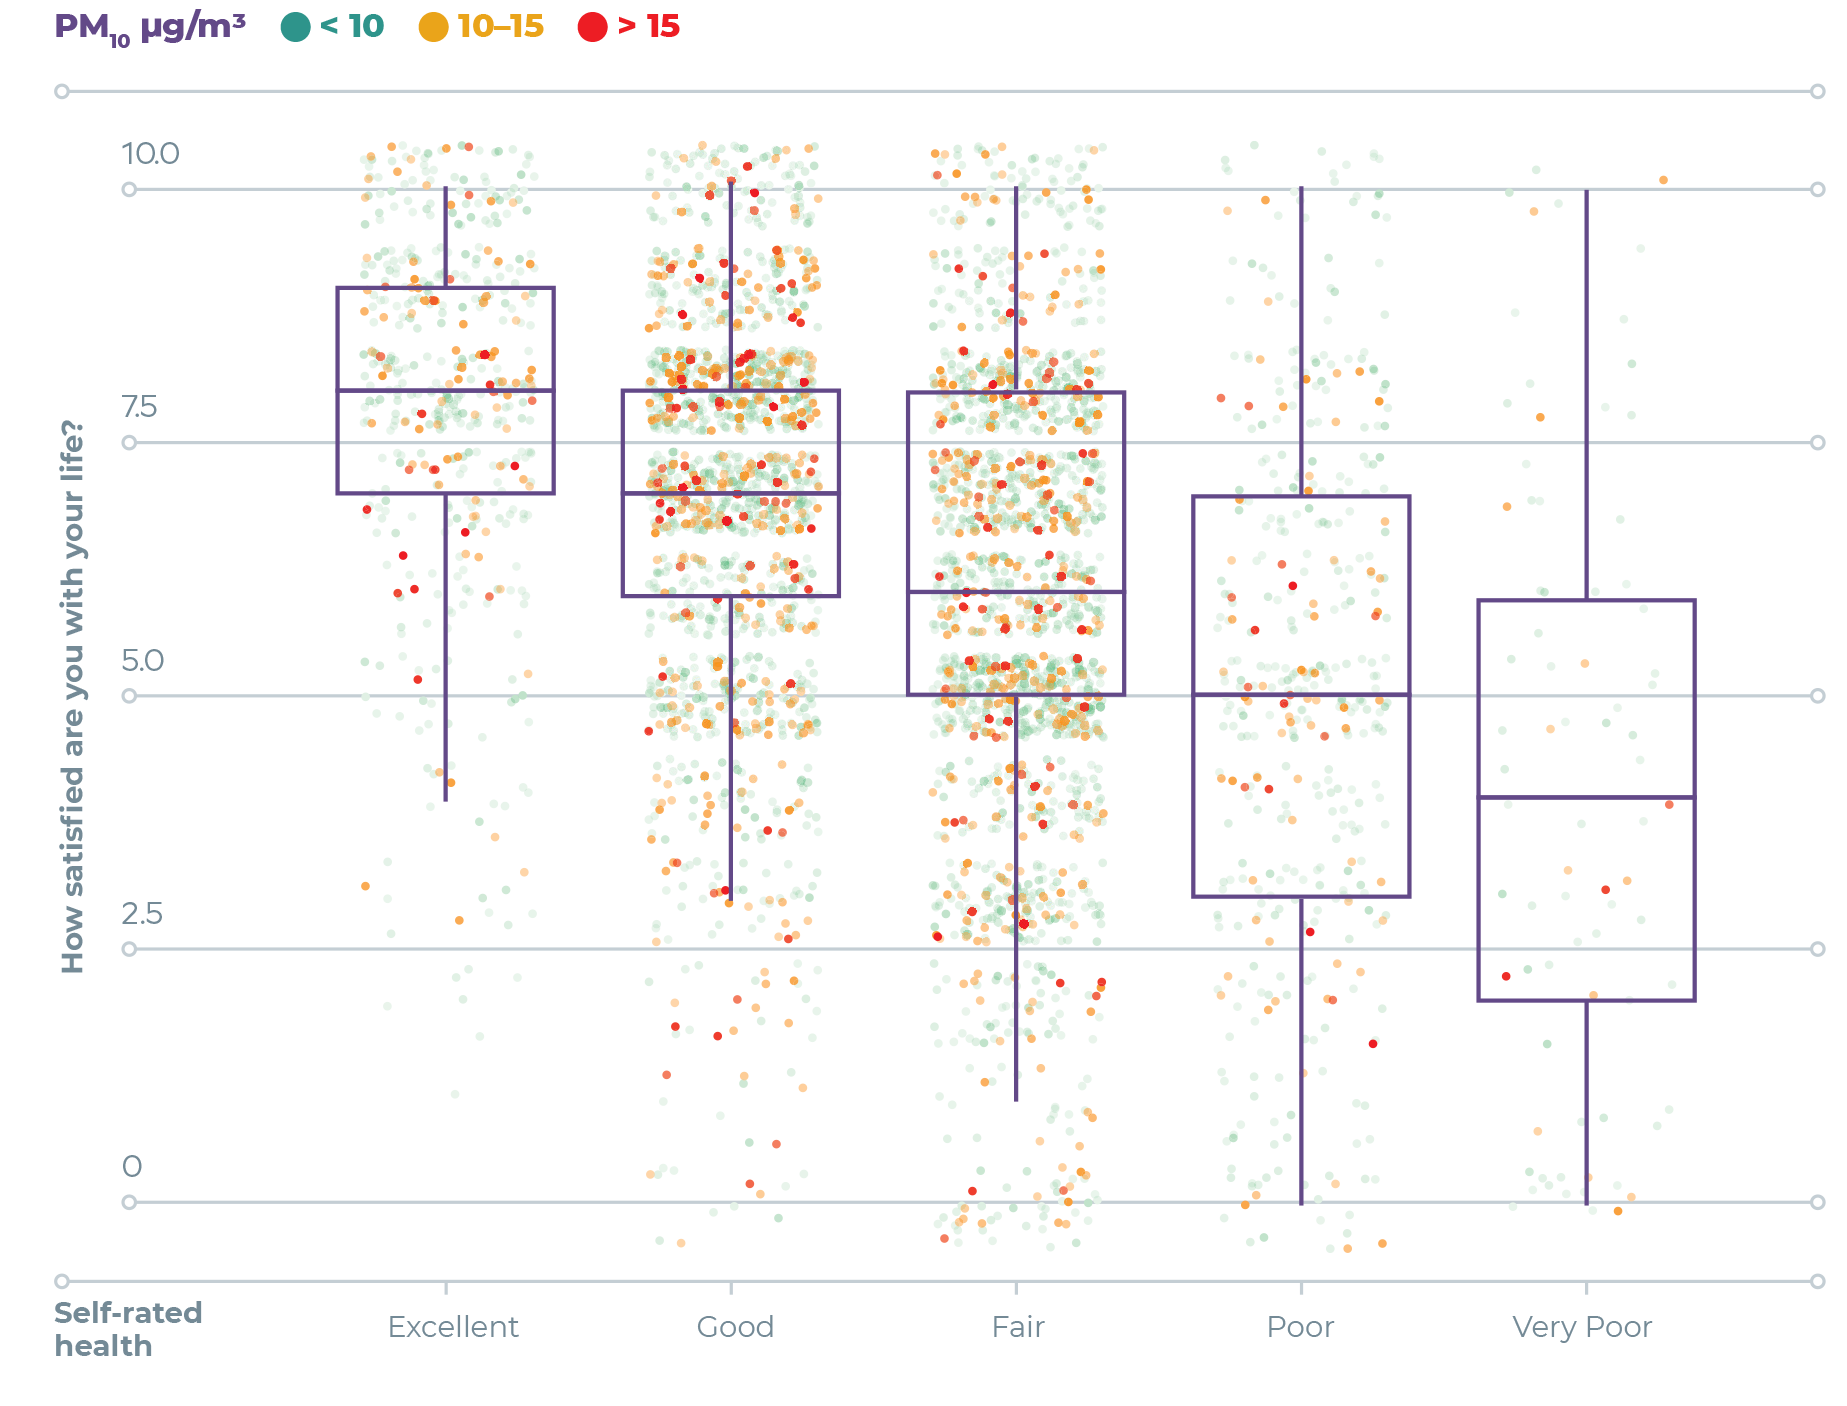
The association between exposure to air pollution and individual life satisfaction was tested in an Estonian analysis where the sociodemographic indicators (marital status, employment, and trust in people and institutions) of people who participated in the European Social Survey in 2010 and 2012 were combined with modelled annual average levels of particulate matter in their place of residence (K. Orru et al. 2016). (K. Orru et al. 2016). The annual levels of modelled particulate matter averaged 8,3 ± 3,9 μg/m3, in the place of residence of Estonian respondents, which means they were generally below the new WHO air quality guidelines. After considering the usual sociodemographic characteristics that affect people’s life satisfaction, the low levels of air pollution still had a statistically significant negative effect on life satisfaction: for a 1 μg/m3 increase in levels of particulate matter, life satisfaction decreased by 0.017 points (on a 10-point scale)(Figure 5.2.6).
When the separate self-rated health indicator was included in the analysis, the effect of air pollution on life satisfaction indicators remained significant. This suggests that the impact of air pollution not only is manifested in physical health but also directly affects our life satisfaction..
3), , respondents’ subjective life satisfaction (0 – extremely dissatisfied, 10 – extremely satisfied) and general self-rated health
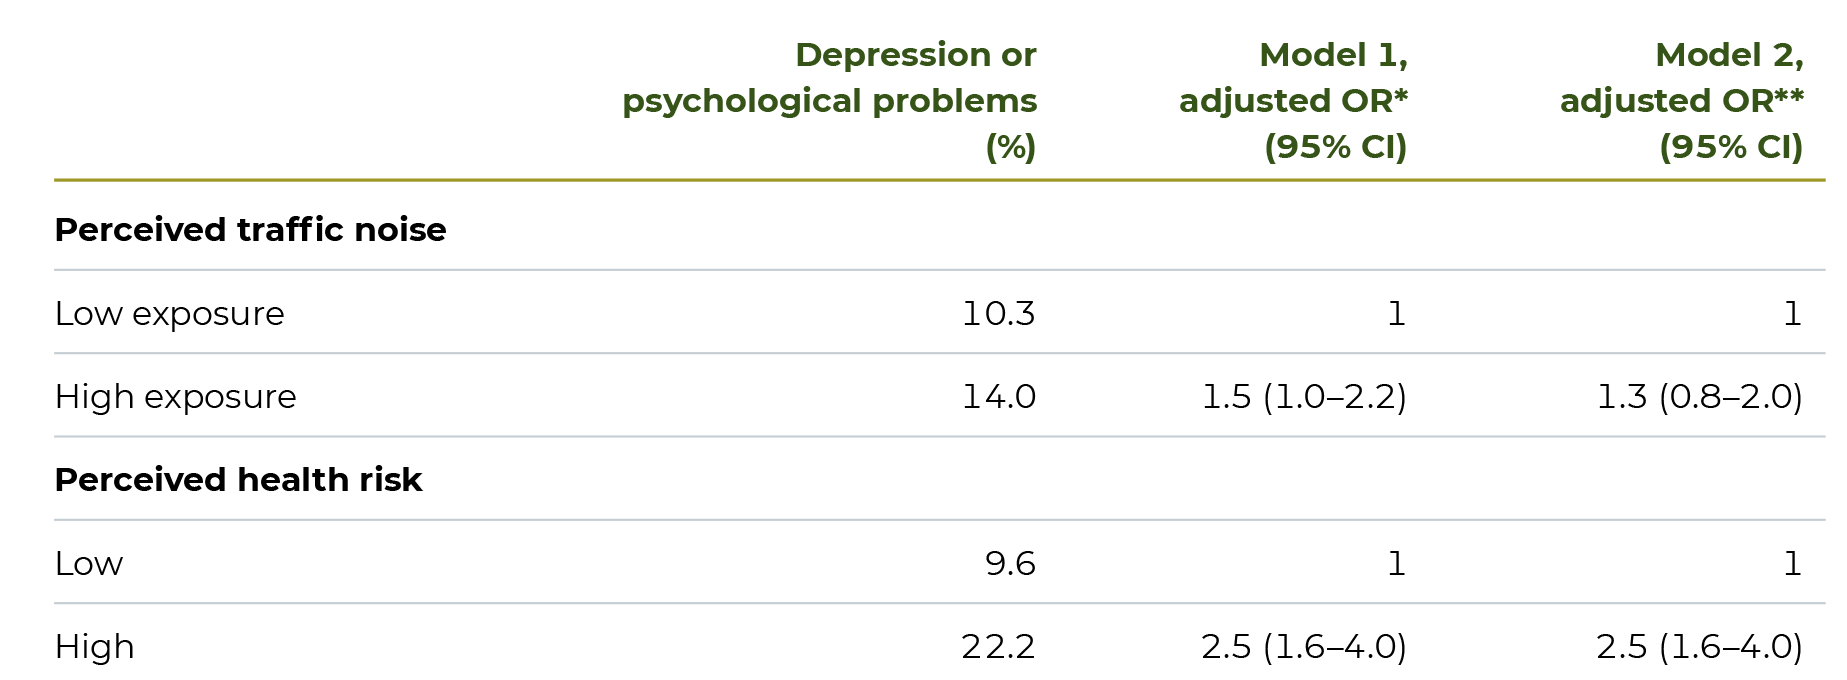
Using the dataset of the KesTeRisk survey(K. Orru et al. 2015), Shepelev (2019) looked at the association between perceived noise exposure, perceived risk and health complaints, and the respondent’s depression or psychological problems.. Despite the fact that 35% of respondents considered their exposure to traffic noise high, 48% of respondents had not taken any action to avoid exposure to its negative impacts. Figure 5.2.2 Figure 5.2.2, shows that traffic and industrial noise played a relatively small role in the risk evaluations. Since the majority (more than 80%) of the respondents are not aware of the impact of traffic noise on health and are therefore not motivated to protect themselves, national institutions must play an important role in protecting people’s health.
Depression or psychological problems were 1.4 to 2.3 times as common among respondents who perceived high exposure to traffic noise or considered noise to be a high health risk (Table 5.2.1). Logistic regression was used to identify associations between traffic noise (self-rated exposure and perceived risk) and depression or psychological problems.
For this purpose, two models were created: Model 1 was adjusted for socioeconomic factors and Model 2 for noise sensitivity. A statistically significant relationship between self-rated exposure to traffic noise and psychological problems emerged in Model 1 but disappeared after statistical adjustment for noise sensitivity in Model 2. However, it is statistically significant that those who perceived traffic noise as a high risk to their health had 2.5 times the chance of developing depression or psychological problems, even after adjusting for noise sensitivity.
Note:
* Model 1 is adjusted for socioeconomic factors.
** Model 2 is additionally adjusted for noise sensitivity.
Eurobarometer surveys have evaluated people’s attitudes about health effects in different countries. The surveys show that Estonian residents are slightly less concerned about environmental health effects than the average respondent in the European Union, but their awareness is increasing.
According to Eurobarometer, in 2005, 47% of Estonian residents believed that health damage from environmental pollution was highly likely or quite likely, but by 2010, this figure had risen to 51% and by 2020 to 70%. Across the EU, an average of 61% of respondents in 2005 and 2010, and 78% in 2020, considered the damage likely. On the other hand, health risks can create fear in people. This is explained by the European Social Survey data, which show that heightened fear of environmental health effects may be related to a generally increased attention to the safety of the living environment and caring about the environment (the share of people valuing each has increased from 15% to 21% and from 26% to 31%, respectively, in the period between 2004 and 2012).
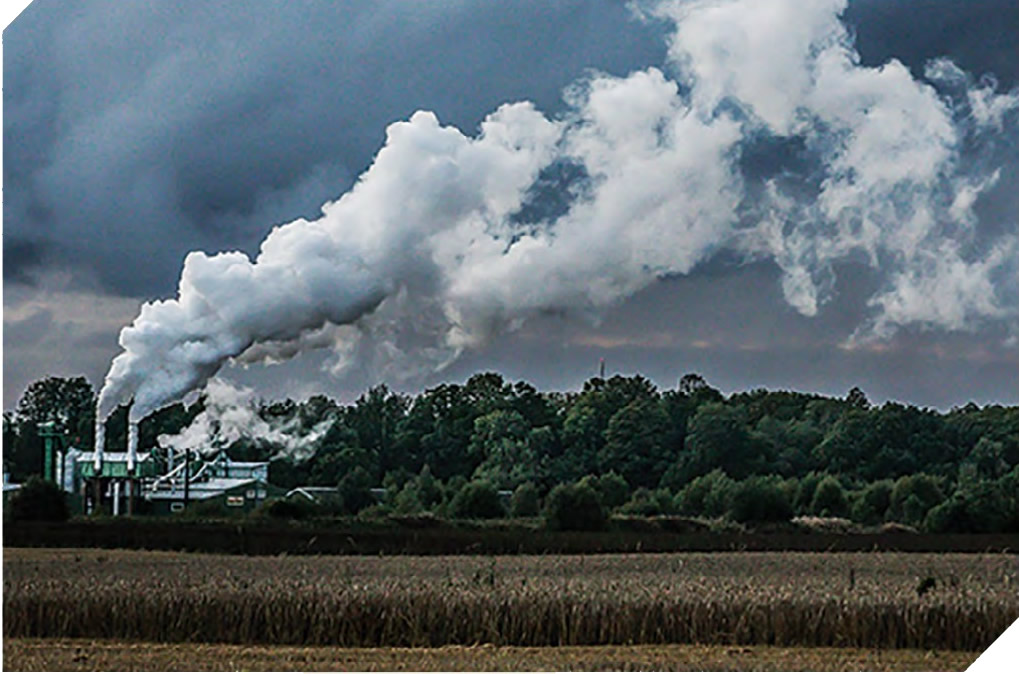
Fear, in turn, causes annoyance. One of the indicators of annoyance is the number of environmental nuisances{1} 6, that residents report to the Health Board or the Environmental Board. Disturbances caused by odoriferous substances are an example of an environmental nuisance. Many pollutants emitted into ambient air, especially from industrial plants, have a specific odour that can be unpleasant. We can smell hydrogen sulfide (H2S) even at very low concentrations, though this does not mean that it is harmful to humans at low levels. While odour nuisance does not have a direct health risk for people, it can cause annoyance. That is why the concept of exceeding the ‘disturbance levels of odoriferous substances’ is used. But noises below the limit values can also cause disturbances and complaints – for example, when a motorcycle passing at night does not exceed the current limits on night noise levels but wakes people up and causes annoyance. Such disturbances can lead to stress and affect mental health.
Odour nuisances are registered by the Estonian Environmental Board. Their impact on the quality of life has not been studied systematically, ent but Kesanurm et al. (2016) found that between 2010 and 2015, residents of the Kohtla-Järve region registered complaints about unpleasant odours on 798 occasions. An evaluation of the presence of odoriferous substances revealed that the unpleasant odour in the area exceeded the odour detection threshold. Hydrogen sulfide was the main cause of the odour nuisance; the main sources were the semi-coke hills7 and sudden emissions.8 from the industry. Since the odour of hydrogen sulfide can be detected at very low concentrations, such levels do not pose a direct threat to health but are still a source of discomfort. Therefore, the owners of the source of disturbance are required to draw up an action plan to reduce the emission of odoriferous substances.
The complaints submitted to the Health Board give an idea of the frequency of noise annoyance that have been analysed in the action plans for reducing ambient noise. For example, 181 noise complaints were filed in Tallinn and 52 in Tartu between 2013 and 2017. According to the Health Board, the problematic areas are those where noise-sensitive buildings are located next to streets with heavy traffic, production facilities or technical equipment. Construction noise and domestic and entertainment noise also cause annoyance. While the number of noise complaints has increased between 2013 and 2017, one of the reasons may be people’s increased expectations for the quality of the environment.
Summary
Studies show that air and noise pollution cause both annoyance and mental health problems for residents. Although the air pollution levels in Estonia are mostly below the limits, they may still cause more sensitive individuals to experience annoyance and health problems. Many people, especially in Ida-Virumaa county, are concerned about the effects of air pollution on their health. However, as most residents in Tallinn and Tartu are exposed to road traffic noise above the limits, it is important to pay more attention to reducing annoyance caused by road traffic in the cities. With increasing awareness of environmental health effects, more and more people in Estonia consider environmental pollution to be a likely cause of health problems.
The perceived risk of air and noise pollution affects both mental and physical health. Well-planned communication is therefore necessary to avoid annoyance and mental health problems, recognising air and noise pollution as health risks without causing unreasonable stress or fear about possible health damage.
People’s trust in environmental experts and the understanding that environmental health risks are discussed honestly and openly in society help to reduce perceived risks and fears (Orru et al. 2015).
Reducing effects on mental health starts by improving air quality and reducing noise levels. The first option would be to increase the number of vehicles that pollute less. For example, cars that comply with the EURO 6 emission standard have lower emissions than older cars. It is also beneficial to restrict the use of studded tyres in cities, because they produce significantly more noise and dust than studless winter tyres. In Stockholm, for example, studded tyres are prohibited on certain streets, and in Oslo you need to buy a special permit. Reducing speed limits is also beneficial, because traffic noise is significantly lower at reduced speeds. Air pollution from domestic heating can be reduced by limiting emissions with better heating methods, higher-quality fuel, less polluting furnaces and technologies, or connecting to district heating in cities Industries need to have more effective control over sudden emissions that occur when starting up machinery or in the event of malfunctions, when significantly more pollutants are released into the air than usual.
Promoting physically active, pollution-free modes of transport, such as cycling, could also help reduce mental health problems. More frequent use of physically active forms of getting around not only decreases the levels of both air and noise pollution in cities but also increases the level of happiness hormones in the body. Due to physical activity, a person sitting on a bicycle is happier and less stressed than a person sitting in a car.
For a long time, the residents of Muuga have been complaining about the unpleasant odours caused by the loading of oil products onto the ships in Muuga Harbour. In addition to the unpleasant smell, several hydrocarbons (e.g. benzene) are potentially health-damaging substances, which in high levels can damage our nervous system and haematopoiesis and can cause cancer. The greatest threat to human health is when the wind carries the fumes from the port towards the surrounding residential areas. To identify such situations, an air quality monitoring system with electronic noses relying on sensors for odours and wind was installed in 2016. 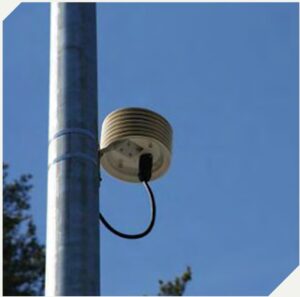 When the wind blows from certain directions and the electronic noses detect high levels of aromatic compounds and other chemical substances, the system alarms the harbour and loading has to be stopped. Although the situation has improved over the years, 121 complaints were still submitted to the Environmental Board in 2020 about unpleasant odours in the area. The Estonian Environmental Research Centre’s analysis of the complaints and data from the electronic noses revealed that only seven of these complaints could be directly connected to activities in the harbour. Since there are also several other industrial companies in the area, the odour problem is broader and requires a more systematic approach to quickly resolve this unpleasant situation for the residents.
In some cases, annoyance due to noise pollution may be unbearable. One such example is the racing track in Audru, where local residents turned to the chancellor of justice in 2018 to find a solution to the problem. Even though there are noise barriers and walls (which are not continuous) and the noise limits are not exceeded, the surrounding residents experience high levels of annoyance. The developer has applied for a building permit to construct higher barriers. An environmental permit is also required, as the developer wants to build the barriers from waste. The planned construction will take years, and the problem will not be resolved any time soon.
In the village of Purila, the residents have been troubled by the local pellet plant for many years. The noise from the plant has been within limits during official assessments, but according to locals, it is much higher during wood crushing. Once again, the locals have appealed to the chancellor of justice, who has pointed out shortcomings in the planning of the plant and insufficient involvement of residents. The residents are disturbed the most by irregular noise, or noise that comes and goes. For example, a hydraulic breaker in the quarry might go ‘thunk-thunk-thunk’, then there is a bit of silence, and then it goes ‘thunk-thunk-thunk’ again.
In cities, air source heat pumps, ventilation units and other devices often cause noise annoyance. In many cases, shopping centres have been required to service or replace their ventilation units or install additional soundproofing to avoid exceeding the limits for night noise levels.
 WARMESTONI PURILA PELLETITEHAS
Andersson, L., Claeson, A.-S., Ledin, L., Wisting, F., Nordin, S. 2013. The influence of health-risk perception and distress on reactions to low-level chemical exposure. – Frontiers in Psychology, 4. https://doi.org/10.3389/fpsyg.2013.00816.
Crichton, F., Petrie, K. J. 2015. Health complaints and wind turbines: The efficacy of explaining the nocebo response to reduce symptom reporting. – Environmental Research, 140, 449–455.
Idavain, J., Julge, K., Rebane, T., Lang, A., Orru, H. 2019. Respiratory symptoms, asthma and levels of fractional exhaled nitric oxide in schoolchildren in the industrial areas of Estonia. – Science of Total Environment, 650 (Pt 1), 65–72. https://doi.org/10.1016/j.scitotenv.2018.08.391.
Kesanurm, K., Maasikmets, M., Teinemaa, E., Saare, K., Paju, M., Vainumäe, K., Arumäe, T., Heinsoo, A., Saidla, M.-E., Kimmel, V. 2016. Välisõhu kvaliteedi, lõhnahäiringu ning saasteainete heitkoguste hindamine Kohtla-Järve linnas Järve linnaosa piirkonnas. Tallinn: Eesti Keskkonnauuringute Keskus OÜ.
Marques, S., Lima, M. L. 2011. Living in grey areas: Industrial activity and psychological health. – Journal of Environmental Psychology, 31(4), 314–322. https://doi.org/https://doi.org/10.1016/j.jenvp.2010.12.002.
Orru, H., Tamm, T., Maasikmets, M., Teinemaa, E., Arumäe, T., Saare, K., Niinemets, Ü., Kännaste, A., Anni, R., Noe, S.-M., Lang, M., Lai, T. 2016. Maapinnalähedase osooni õhusaaste ekspositsiooni analüüs ja tervisemõjude hinnang. Tartu: Tartu Ülikool.
Orru, H., Teinemaa, E., Maasikmets, M., Keernik, H., Paju, M., Sikk, A., Tamm, T., Lainjärv, H. M., Kriit, H. K., Lõhmus Sundström, M. 2022. Välisõhu kvaliteedi mõju võrdlus inimeste tervisele Eestis aastatel 2010 ja 2020 ning õhusaaste tervisemõjude prognoos aastaks 2030. Tartu: Tartu Ülikool, Eesti Keskkonnauuringute Keskus OÜ.
Orru, H., Veber, T., Ründva, M., Tamm, T. 2020. Direktiivi 2002/49 III lisa muutmise eelnõus kavandatava müra terviseohtlikkuse hindamise meetodi sobilikkuse hindamine Eesti tingimustes Tallinna ja Tartu linna ning põhimaanteede näitel. Tartu: Tartu Ülikool.
Orru, K., Hendrikson, R., Nordlund, A., Nutt, N., Veber, T., Orru, H. 2015. KesTeRisk. Keskkonnatervis: arusaamine riskidest ja motivatsioon tervisemõjude vähendamiseks. Analüüsi aruanne. Tartu Ülikool, Terviseamet.
Orru, K., Nordin, S., Harzia, H., Orru, H. 2018. The role of perceived air pollution and health risk perception in health symptoms and disease: A population-based study combined with modelled levels of PM10. – International Archives of Occupational and Environmental Health, 91(5), 581–589. https://doi.org/10.1007/s00420-018-1303-x.
Orru, K., Orru, H., Maasikmets, M., Hendrikson, R., Ainsaar, M. 2016. Well-being and environmental quality: Does pollution affect life satisfaction? – Quality of Life Research, 25(3), 699–705. https://doi.org/10.1007/s11136-015-1104-6.
Pindus, M., Orru, H., Maasikmets, M., Kaasik, M., Jõgi, R. 2016. Association between health symptoms and particulate matter from traffic and residential heating: Results from RHINE III in Tartu. – Open Respiratory Medicine Journal, 10, 58–69. https://doi.org/10.2174/1874306401610010058.
Shepelev, A. 2019. Tajutud liiklusmüra ja tervisenäitajate vaheline seos. Magistritöö. Tartu: Tartu Ülikool.
Stenlund, T., Lidén, E., Andersson, K., Garvill, J., Nordin, S. 2009. Annoyance and health symptoms and their influencing factors: A population-based air pollution intervention study. – Public Health, 123(4), 339–345. https://doi.org/10.1016/j.puhe.2008.12.021.
Sucker, K., Both, R., Bischoff, M., Guski, R., Winneke, G. 2008. Odor frequency and odor annoyance. Part I: Assessment of frequency, intensity and hedonic tone of environmental odors in the field. – International Archives of Occupational and Environmental Health, 81, 671–682. https://doi.org/10.1007/s00420-007-0259-z.
Veber, T., Tamm, T., Ründva, M., Kriit, H. K., Pyko, A., Orru, H. 2021. Health impact assessment of transportation noise in two Estonian cities. – Environmental Research, 204(Pt C). https://doi.org/https://doi.org/10.1016/j.envres.2021.112319.
WHO 2018. Environmental noise guidelines for the European region. Copenhagen: World Health Organization.