Life satisfaction in Estonia
Life satisfaction is one of the most important indicators of individual quality of life and subjective well-being. It represents a person’s overall assessment of the different aspects of their life. There are various indicators for assessing subjective well-being, most of which express either a ratio of positive and negative emotions, general life satisfaction, or satisfaction related to specific areas of life (Brulé and Maggino 2021; Sirgy 2020). Life satisfaction is primarily the outcome of an evaluation of aspirations and achievements (Haller and Hadler 2006) and is related to all significant indicators of the quality of life in society, including health, economic situation, democracy, social relations, work, trust, etc. (Graham 2009).
Previous studies in Estonia have shown that the transition period that began with the restoration of national independence in 1991 led to a decline in life satisfaction (Ainsaar 2011). Only a third of the population was satisfied with their lives in 1996,
and the satisfaction of different age and education groups was increasingly stratified (Easterlin 2009; Ainsaar 2011). The year 1996 marked the beginning of a stabilisation period that followed the era of rapid transition. The restructuring of the economy brought along a drop in employment and a rise in unemployment. As wealth increased, life satisfaction began to grow. By 2002–2003, life satisfaction reached the 1990 level. The period from 2002 to 2008 saw rapid economic growth and an increased life satisfaction. However, the economy was not the only factor influencing life satisfaction, as this was also dependent on gender, age, health, trust and social support (Ainsaar 2006; Ainsaar 2008b). he increase in life satisfaction continued until 2006–2008. Unsurprisingly, the economic crisis that followed in 2009 led to a decrease in life satisfaction, a decline in income and cuts in social spending. Unemployment rates rose back to 2001 levels.
Previous studies have shown that, in addition to economic situation, factors that boost life satisfaction are good health and trust in people (Suldo and Huebner 2006; Ainsaar 2008b). conomic situation affects satisfaction both directly and through various coping mechanisms and changes in people’s competitiveness. Looking back at the research conducted thus far, Graham (2009) concludes that the more economically developed the country, the more complex the relationship between income and life satisfaction
After reaching a certain level of economic wellbeing, people possess more freedom to choose between different preferences. Some may want to exchange the security of a higher income for other non-material benefits.
The phenomenon of economic wealth is believed to lie in the fact that greater wealth gives people the freedom to use their resources, while having a lower income forces people to focus on meeting basic needs (Drakopoulos 2008). Drakopoulos notes, however, that taking care of basic needs has a stronger positive effect on happiness than addressing higher-level needs.
This article provides an overview of the changes in Estonians’ life satisfaction over time and compares these with those of other countries and between different sociodemographic groups. In particular, we will be looking at the period between 2008 and 2021, which covers both the rapid economic growth that followed the 2009 crisis and the COVID-19 crisis of 2020–2021. In addition to presenting descriptive time series, the article analyses how life satisfaction interacts with self-rated health, income, social status and trust in other people. The last part of the article explores the relationship between life satisfaction and health, including mental health, looking specifically at the period that started with the spread of the coronavirus in 2020.
We rely on data from the 2004–2021 European Social Survey (ESS) and the 2021–2022 Estonian National Mental Health Study. To measure life satisfaction, we use the question about general subjective well-being: ‘All things considered, how satisfied are you with your life as a whole nowadays? Please answer on a scale of 0 to 10, where 0 means extremely dissatisfied and 10 means extremely satisfied.’ Our graphics display the share of respondents whose answers ranged from 6 to 10 (i.e. they were at least somewhat satisfied with life).
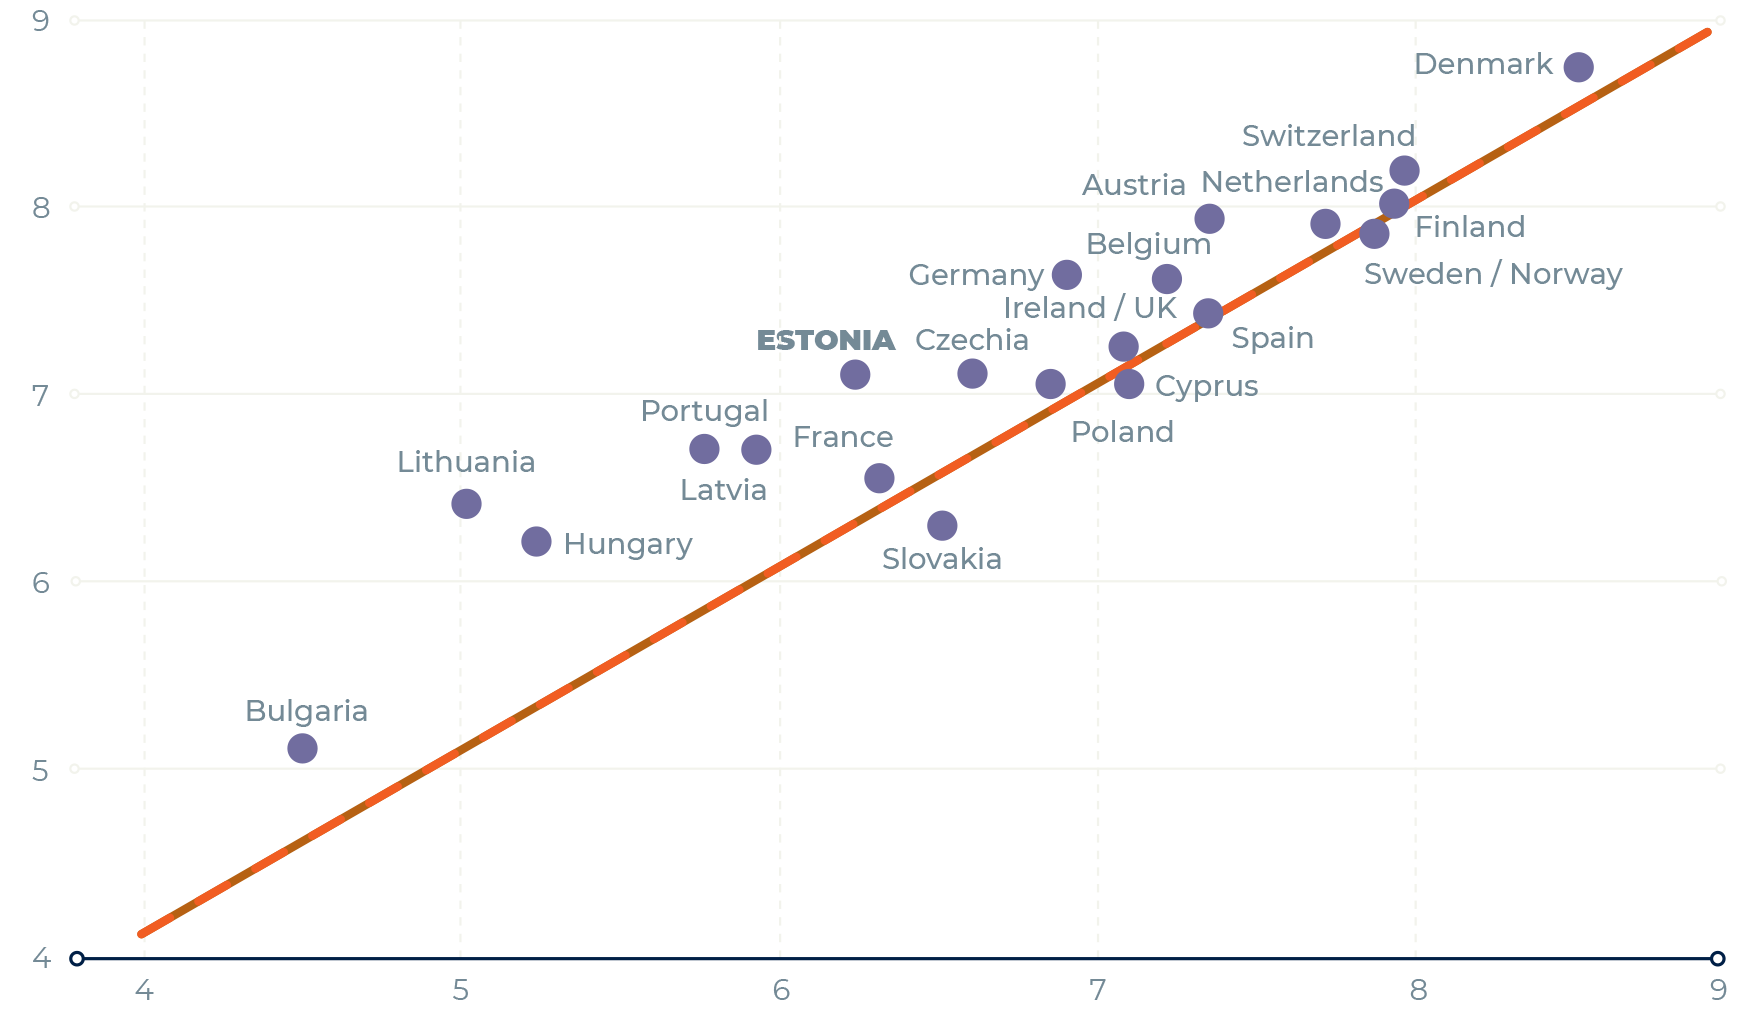
Between 2008 and 2018, the life satisfaction of Europeans generally increased. In Estonia, this increase was even faster than in other countries (Figure 1.1.1.). In 2008, Estonia was among the countries with a below-average level of life satisfaction. Ten years later, while Estonia has still not caught up with the Nordic countries, its average satisfaction matches that of Poland, Ireland and the United Kingdom, to name a few. Throughout the Estonian population,
the share of people who feel at least somewhat satisfied with their lives has increased: it was 60% in 1990, 37% in 1996, 56% in 2002, 64% in 2008, 79% in 2018 and 84% in 2021.
The studies conducted in Estonia before and during the COVID-19 pandemic enable us to take a more detailed look at how life satisfaction changed during this period (Figure 1.1.2). We used data from the 2019 Estonian Health Interview Survey and the 2021 and 2022 Estonian National Mental Health Study.
The samples of these studies and their questions about life satisfaction differ from those of the ESS and thus are not comparable to them. Nevertheless, these data enabled us to conduct a more targeted temporal analysis of the COVID-19 pandemic era. The analysis revealed that the share of respondents who are at least somewhat satisfied with life has statistically significantly decreased between 2019 and February 2021 (90% in 2019, 76% in early 2021, 79% in the spring/summer of 2021, 72% in early 2022). The decrease in life satisfaction between 2019 and 2021 was likely brought on by the COVID-19 crisis and related socioeconomic problems. The differences were smaller but also statistically significant between the three waves of the Estonian National Mental Health Study conducted in 2021 and 2022. In May and June 2021, the share of people satisfied with life was slightly higher than in the first winter months of 2021 and 2022, when the coronavirus caused greater problems and society was under more pressure (Figure 1.1.2).
J1.1.2.R
maiko.koort
2023-06-14
library(ggplot2)
library(dplyr)
##
## Attaching package: 'dplyr'## The following objects are masked from 'package:stats':
##
## filter, lag## The following objects are masked from 'package:base':
##
## intersect, setdiff, setequal, unionlibrary(tidyr)
#faili sisselugemine ja korrigeerimine
J112=read.csv("PT1-T1.1-J1.1.2.csv",header=TRUE, encoding ="UTF-8")
J112=na.omit(J112)
labels=sub("X","",names(J112))[2:5]
J112[4,1]="Extremely dissatisfied\n(Not at all satisfied)"
#andmestiku formaadi muutmine ja uued veerunimed
J112=pivot_longer(J112,col=c("ETeU.2019","X01.02.2021","X05.06.2021","X01.02.2022"))
names(J112)=c("Vastus","Aeg","Osakaal")
#joonis
ggplot(J112)+
geom_col(aes(x=Aeg,y=Osakaal,fill=Vastus))+
scale_fill_manual(values=c("#FF3600","#982F1A","#6666CC","#1E272E"))+ #Et anda ette terve vektor värve, on vaja lisada eraldi funktsioon. Siin on vaja sätida "täidet" (filli), seega scale_fill_manual
theme_minimal()+
ylab("%") +
xlab("")+
scale_x_discrete(labels=labels,limits=c("ETeU.2019","X01.02.2021","X05.06.2021","X01.02.2022"))+
scale_y_continuous(breaks=c(20,40,60,80,100))+
theme(legend.spacing.y = unit(2, 'cm'))+
guides(fill = guide_legend(byrow = TRUE))+
theme(text = element_text(color="#668080"),axis.text=element_text(color="#668080"))+
theme(legend.title=element_blank())+
theme(plot.margin=unit(c(0.5,4.5,0.5,0.5),"cm"))+
theme(legend.position = "bottom")
In the following, we will examine the relationship between life satisfaction and age, employment status, income and health. There have been no systematic studies on differences in life satisfaction in Estonia based on gender. However, empirical data show that in some years, women and men report the same level of life satisfaction, while in other years, women are more satisfied with life than men. As we could find no clear pattern in this category, we concluded that this topic requires separate, in-depth treatment.
One of the models often cited in the literature is the U-shaped curve in satisfaction – the idea that younger and older people are more satisfied with life than middle-aged people (Easterlin 2006). Realo and Dobewall (2011) Realo and Dobewall (2011) have also found signs of U-shaped life satisfaction in Estonia, attributing it to both contemporary and generational effects. However, the long time series shows that while the life satisfaction of older people in Estonia has grown at the same pace as that of working-age people, it is not as high (Figure 1.1.3). It is only during the few years of crises in the early 1990s and again in 2008 and 2009 that the life satisfaction of older people is relatively close to that of working-age people. Although life satisfaction increased in both older people and working-age people between 2018 and 2021, the gap between the two age groups did not change.
J1.1.3.R
maiko.koort
2023-06-14
library(tidyr)
library(ggplot2)
#faili sisselugemine ja andmete formaadi korrigeerimine
J113=read.csv("PT1-T1.1-J1.1.3.csv",header=TRUE, encoding ="UTF-8")
J113=na.omit(J113)
names(J113)[2:4]=c("15-24","25-64","65+")
J113=pivot_longer(J113,col=c("15-24","25-64","65+"),"Age")

#joonis
ggplot(J113)+
  geom_line(aes(x=Year,y=value,col=Age),linewidth=1.5)+
  scale_color_manual(values=c("#6666CC","#FF3600","#8FA300"))+ #siin ei ole funktsioon mitte fill vaid color, kuna joonobjektid.
  ylab("% of people at least somewhat satisfied with life")+
  xlab("")+
  scale_x_continuous(breaks=(unique(J113$Year)))+
  scale_y_continuous(breaks=c(0,25,50,75,100),limits=c(0,100))+
  theme_minimal()+
  theme(text = element_text(color="#668080"),axis.text=element_text(color="#668080"))
As expected, young people have the highest life satisfaction ratings of all the groups. And out of all the groups, theirs changed the least after 2008. The high life satisfaction of young people has also been observed in past studies, both in Estonia and internationally (Ainsaar 2008a).
The share of people aged 15 to 24 in Estonia who are not satisfied with life is remarkably small: 5% in 2021.
In the following, we will compare life satisfaction between social groups with different employment statuses. looking at students, unemployed people and retired people versus working people (Figure 1.1.4). Although work-related activities are related to age, this relationship is not definitive. In Estonia, many people continue to work after reaching retirement age, not all young people are students, and working-age people include not only those who are employed but also those who are unemployed and out of the labour market.
J1.1.4.R
maiko.koort
2023-06-14
library(tidyr)
library(ggplot2)
#faili sisselugemine ja andmete formaadi korrigeerimine
J114=read.csv("PT1-T1.1-J1.1.4.csv",header=TRUE, encoding ="UTF-8")
J114=na.omit(J114)
names(J114)=c("Year","Studying","Working","Retired","Unemployed")
J114=pivot_longer(J114,col=names(J114[,2:5]),"Grupp")


#joonis
ggplot(J114)+
  geom_line(aes(x=Year,y=value,col=Grupp), linewidth=1.5)+
  scale_color_manual(values=c("#6666CC","#FF3600","#8FA300","#4DB3D9"),breaks=c("Studying","Working","Retired","Unemployed"))+
  scale_x_continuous(breaks=(unique(J114$Year)))+
  scale_y_continuous(breaks=c(0,25,50,75,100),limits=c(0,100))+
  ylab("% of people at least somewhat satisfied with life")+
  theme_minimal()+
  theme(text = element_text(color="#668080"),axis.text=element_text(color="#668080"))+
  theme(legend.title=element_blank())
The number of people with different employment statuses and these groups’ life satisfaction directly impacts the country’s average life satisfaction indicators. For example, a large number of unemployed people can quickly reduce average life satisfaction.
Working people are the largest group in Estonia, and over the years, their life satisfaction has reflected the general life satisfaction trends in society: the year 1990 was followed by a decline that lasted until the mid-1990s, and the rise of the early 21st century was temporarily halted by the economic crisis of 2008–2009. When the economic crisis subsided, satisfaction continued its rapid growth, which did not stop even during the challenging years brought on by COVID-19.
Even though the overall level of life satisfaction has increased, the gap between the life satisfaction of the wealthiest and the poorest continues to be significant (Figure 1.1.5). Between 2018 and 2021, life satisfaction increased in all income groups. Remarkably, even the poorest people were able to improve their life satisfaction.
Life satisfaction has a strong relationship with self-rated health (Ainsaar 2008a). Figure 1.1.6 shows that life satisfaction has increased in all groups and, as expected, differs depending on personal health. From 2018 to 2021, life satisfaction increased mainly in groups with good or satisfactory health, and the gap with the life satisfaction of the group with the worst health widened. It is noteworthy that, among people with the worst health, the rise in life satisfaction stopped.
Where in Estonia are people most satisfied with life? In early 2022, the county with the highest level of satisfaction was Läänemaa, where 82% of respondents were satisfied or somewhat satisfied with life. There were five regions with a statistically significant difference from Läänemaa: Ida-Virumaa (59%), Pärnumaa (73%), Põlvamaa (71%), Tallinn (71%) and Võrumaa (70%). Regional differences in life satisfaction (especially in Ida-Virumaa) can be largely – but not entirely – attributed to regional socioeconomic differences (e.g. different income and education).
J1.1.5.R
maiko.koort
2023-06-14
library(tidyr)
library(ggplot2)
#faili sisselugemine ja andmete formaadi korrigeerimine
J115=read.csv("PT1-T1.1-J1.1.5.csv",header=TRUE, encoding ="UTF-8")
J115=J115[1:12,]
names(J115)[1]=c("Year")
J115=pivot_longer(J115,col=names(J115[,2:4]),"Income")
J115$Income=as.factor(J115$Income)
J115$Income=factor(J115$Income,levels(J115$Income)[order(c(2,3,1))])


#joonis
ggplot(J115)+
  geom_line(aes(x=Year,y=value,col=Income),linewidth=1.5)+
  scale_color_manual(values=c("#6666CC","#E06637","#8FA300"), breaks=rev(levels(J115$Income)))+
  ylab("Eluga pigem rahul olevate inimeste %")+
  scale_x_continuous(breaks=(unique(J115$Year)))+
  scale_y_continuous(breaks=c(0,25,50,75,100),limits=c(0,100))+
  theme_minimal()+
  theme(text = element_text(color="#668080"),axis.text=element_text(color="#668080"))
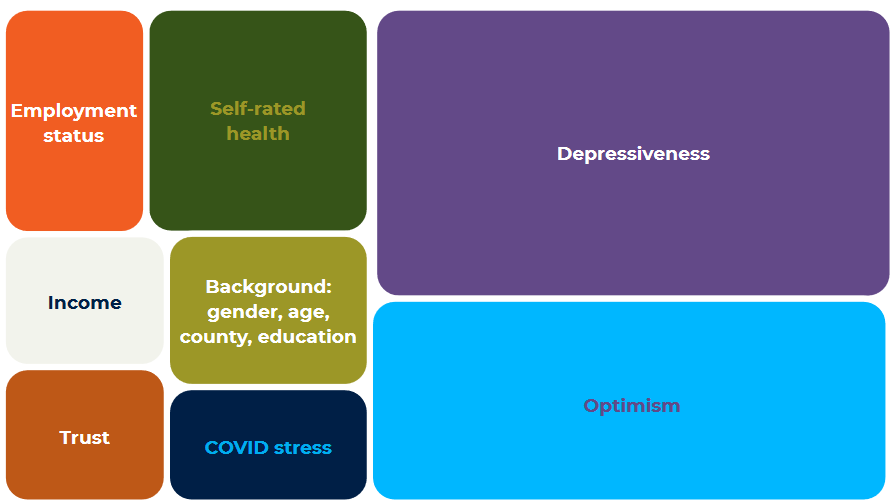
We have seen that life satisfaction depends on several different factors, such as age, education, income and health. But what is the contribution of these factors in interaction with and relative to each other? To find out, we used data compiled in early 2022 for the Estonian National Mental Health Study, which, in addition to the factors listed above, measured various mental health indicators. The COVID-19 pandemic led to increased mental health problems in the population (Consortium of the Estonian National Mental Health Study 2022), making it particularly relevant to include mental health indicators in a model analysing life satisfaction.
Figure 1.1.7 shows that, out of the factors discussed above, self-rated health had the strongest association with life satisfaction. Self-rated health has about as much influence as regional and social background, employment status (studying/working/unemployed) and income combined.
The only mental health indicator that predicted the level of life satisfaction was depressiveness, and this association was extremely strong. The other indicators featured in our model are optimism and a hopeful view of the future (‘”optimism” in the figure), the level of stress the respondent experienced in connection to the COVID crisis (“COVID stress” in the figure) and the level of trust the respondent has in other people (“COVID stress” in the figure). Taking all these variables into account, the model accounts for about 45% of the variability in life satisfaction.
J1.1.6.R
maiko.koort
2023-06-14
library(tidyr)
library(ggplot2)
#faili sisselugemine ja andmete formaadi korrigeerimine
J116=read.csv("PT1-T1.1-J1.1.6.csv",header=TRUE, encoding ="UTF-8")
J116=na.omit(J116)
names(J116)[2:10]=c("2004","2006","2008","2010","2012","2014","2016","2018","2021")
J116=pivot_longer(J116,col=names(J116[,2:10]),"Year")
J116$Year=as.numeric(J116$Year)

#joonis
ggplot(J116)+
  geom_line(aes(x=Year,y=value,col=Answer),linewidth=1.5)+
  scale_color_manual(values=c("#6666CC","#FF3600","#8FA300"),breaks=c("Good","Satisfactory
","Bad"))+ #siin ei ole funktsioon mitte fill vaid color, kuna joonobjektid.
  ylab("% of people at least somewhat satisfied with life")+
  scale_x_continuous(breaks=(unique(J116$Year)))+
  scale_y_continuous(breaks=c(0,25,50,75,100),limits=c(0,100))+
  theme_minimal()+
  theme(text = element_text(color="#668080"),axis.text=element_text(color="#668080"))+
  labs(col = "Self-assessment of health")
This article aimed to provide an overview of changes in Estonians’ life satisfaction over three decades and to analyse the factors that influenced life satisfaction specifically in 2021 and 2022. The data showed that life satisfaction has increased in Estonia as well as Europe, both in the long term and over the last decade, and that the increase in Estonia has been even faster than in other countries. Ün general, the life satisfaction of Estonians falls within the European average. The COVID-19 pandemic had a negative impact on life satisfaction: average life satisfaction fell slightly from the beginning of 2021 to the beginning of 2022.
Life satisfaction in Estonia depends on age, income, health, employment status and several other factors. In 2022, for example, the factors with the strongest influence on life satisfaction were related to mental health and included depressive tendencies, COVID stress, and optimism and a hopeful view of the future. Employment status and income combined have a stronger influence on life satisfaction than demographic factors. Health is a more important factor than income in influencing satisfaction
Ainsaar, M. 2006. Õnne ja rahulolu regionaalsed erinevused. – Servinski, M., Kivilaid, M. (koost). Linnad ja vallad arvudes. Tallinn: Statistikaamet, 108–113.
Ainsaar, M. 2008a. Miks laps on õnnelik? Isiksuseomaduste ja keskkonna mõju 15–18-aastaste noorte õnnele kümnes Euroopa riigis. – Ots, L. (toim). Uued ajad – uued lapsed. Tallinn: Tallinna Ülikooli Kirjastus, 63–80.
Ainsaar, M. 2008b. Ühiskonna toetus, usaldus, tervis ja majanduslik toimetulek kui laste ja lastevanemate rahulolu mõjutavad tegurid Euroopa 13 riigis. – A. Ainsaar, D. Kutsar (toim). Eesti Euroopa võrdlustes. Tallinn: Sotsiaalministeerium, 49–66.
Ainsaar, M. 2011. Subjektiivse heaolu muutus Balti riikides 1990−2009. – Lauristin, M. (toim). Eesti inimarengu aruanne 2010/2011. Inimarengu Balti rajad: muutuste kaks aastakümmet. Tallinn: SA Eesti Koostöö Kogu, 82–87 (lk. 82-87). Eesti Koostöö Kogu.
Brulé, G., Maggino, F. 2021. Towards more complexity in subjective well-being studies. – Brulé, G., Maggino, F. (eds.). Metrics of Subjective Well-Being: Limits and improvements. Happiness Studies Book Series. Cham: Springer, 1–17. https://doi.org/10.1007/978-3-319-61810-4_1.
Budescu, D. V. 1993. Dominance analysis: A new approach to the problem of relative importance of predictors in multiple regression. – Psychological Bulletin, 114(3), 542–551. https://doi.org/10.1037/0033-2909.114.3.542.
Drakopoulos, S. 2008. The paradox of happiness: Towards an alternative explanation. – Journal of Happiness Studies, 9(2), 303–315.
Easterlin, R. A. 2006. Life cycle happiness and its sources: Intersections of psychology, economics and demography. – Journal of Economic Psychology, 27, 463–482.
Easterlin, R. A. 2009. Lost in transition: Life satisfaction on the road to capitalism. – Journal of Economic Behavior and Organization, 71, 130−145.
Eesti rahvastiku vaimse tervise uuringu konsortsium 2022. Eesti rahvastiku vaimse tervise uuringu lõpparuanne. Tallinn,
Tartu: Tartu Ülikool, Tervise Arengu Instituut. https://tai.ee/et/valjaanded/eesti-rahvastiku-vaimse-tervise-uuring-lopparuanne.
Graham, C. 2009. Happiness Around the World: The paradox of happy peasants and miserable millionaires. Oxford: Oxford University Press.
Haller, M., Hadler, M. 2006. How social relations and structures can produce happiness and unhappiness: An international comparative analysis. – Social Indicators Research, 75, 169–216.
Realo, A., Dobewall, H. 2011. Does life satisfaction change with age? A comparison of Estonia, Finland, Latvia, and Sweden.
– Journal of Research in Personality, 45, 297–308. http://dx.doi.org/10.1016/j.jrp.2011.03.004.
Sirgy, M. J. 2020. Positive Balance: A theory of well-being and positive mental health. Cham: Springer.http://ebookcentral. proquest.com/lib/tartu-ebooks/detail.action?docID=6231450.
Suldo, S. M., Huebner, E. S. 2006. Is extremely high life satisfaction during adolescence advantageous? – Social Indicators Research, 75, 179–203.