The changing patterns of health-supporting and health-damaging behaviours and the mental health of adults
Certain patterns emerge when one takes a closer look at human behaviour.
This is to be expected, as specific stimuli tend to elicit similar responses. We also know that people can be categorised into population groups based on their shared characteristics; each group shares a common denominator and features that distinguish it from the others. Therefore, individual behaviour cannot necessarily be viewed separately from behavioural patterns in the population, given that our social context influences and directs our behavioural choices through various norms and rewards, creating behavioural opportunities and causing or reducing stress.
Since much of the population’s health loss is caused by diseases that are either avoidable or preventable (Alwan et al. 2010), social context also has an essential role in explaining why some people remain healthy while others become ill. This process is far from random: it is shaped by the interplay of resources provided by the surrounding environment and individual behavioural choices and opportunities.
The same pattern applies to health behaviour and therefore helps explain the relationship between lifestyle and mental health. However, the social environment is not something that remains constant over time. Let’s consider, for example, how our own daily life has changed over the past few decades. Since changes in the health behaviour of the population form the starting point for changes in physical and mental health, the current situation in population’s health behaviour and mental health should be viewed in the context of the developments in the past.
This article aims to describe and analyse the relationship between lifestyle and mental health in the adult population of Estonia. The empirical part of the article is based on the 1990 – 2020 data from the survey Health Behaviour among Estonian Adult Population and examines associations between lifestyle indicators and mental health outcomes over the past 30 years. By focusing on the indicators of health and risk behaviour and manifestations of their unequal distribution, this article aims to provide a brief insight into the relationships between lifestyle and mental health in adulthood and how their patterns in Estonia have changed over time.
While there have been several surveys among the Estonian population that could be used to describe the relationship between lifestyle and mental health, the survey offers the longest timeline.Health Behaviour among Estonian Adult Population (TKU). This cross-sectional, population-based survey conducted every two years among Estonian residents aged from 16 to 64 first took place in 1990. Its data allow us to describe several indicators of health status and health behaviour and their determinants over the past 30 years.
Since the question about self-reported stress1 has been phrased in the same way throughout all the waves of the study, this indicator provides a good basis for discussing the long-term trends of mental health. The long-term prevalence trends of stress and multiple health behaviour indicators2 (vt Figure 2.3.1) reveal several interesting changes. The prevalence of unbearable or excessive stress was lowest (16%) in the 1990 survey but increased rapidly in subsequent years, reaching 28% in 1996. The prevalence of stress decreased in the first years of the 2000s, reaching 18% in 2006. However, the prevalence of stress increased again in the following years correlating with the onset of economic crisi. There have been no major changes during the past decade; on average, one in five adults experiences excessive stress.
J2.3.1.R
maiko.koort
2023-07-09
library(ggplot2)
library(tidyr)
library(scales)
library(dplyr)
##
## Attaching package: 'dplyr'## The following objects are masked from 'package:stats':
##
## filter, lag## The following objects are masked from 'package:base':
##
## intersect, setdiff, setequal, union#faili sisselugemine ja andmete formaadi korrigeerimine
J231=read.csv("PT2-T2.3-J2.3.1.csv",header=TRUE, encoding ="UTF-8")
J231x=J231[1:5,1:17]
J231x=pivot_longer(J231x,2:17)
J231y=J231[8:17,1:17]
J231y[2,1]=J231y[1,1]
J231y[4,1]=J231y[3,1]
J231y[6,1]=J231y[5,1]
J231y[8,1]=J231y[7,1]
J231y[10,1]=J231y[9,1]
J231y$Cl=rep(c("low","high"),5)
J231y=pivot_longer(J231y,2:17)
J231y=pivot_wider(J231y,names_from=Cl,values_from=value)
J231=cbind(J231x,J231y[,3:4])
names(J231)[1:2]=c("Faktor","Year")
J231$Year=sub("X","",J231$Year)
sildid=na.omit(J231)%>%group_by(Faktor)%>%filter(Year%in%c(min(Year),max(Year)))
#joonis
ggplot(J231,aes(x=Year,y=value,col=Faktor))+
geom_line(aes(group=Faktor), linewidth=1.5)+
geom_point(aes(group=Faktor),cex=2)+
geom_label(data=sildid,aes(x=Year,y=value,label=paste(round(value),"%",sep="")),cex=3,show.legend = FALSE)+
theme_minimal()+
theme(legend.title=element_blank())+
theme(legend.position = "bottom")+
ylab("")+
guides(color = guide_legend(nrow=2,byrow = TRUE)) +
scale_color_manual(values=c("#1E272E","#FF3600","#6666cc","#668080","#f09d00"))+
theme(text = element_text(color="#668080"),axis.text=element_text(color="#668080"))## Warning: Removed 6 rows containing missing values (`geom_line()`).## Warning: Removed 6 rows containing missing values (`geom_point()`).
If we add certain health behaviour trends to the mix, we see even more significant changes over the past three decades. In 1990, daily smokers made up 30% of the Estonian population aged from 16 to 64. This percentage remained stable until the middle of the next decade, when the share of daily smokers in the population started a consistent decline. The trend of alcohol use can be observed since the survey of 1996, when 21% of the population consumed alcohol once a week or more. Although there has been no significant change in the frequency of alcohol use over time, the proportion of frequent alcohol consumers was somewhat higher between 2006 and 2012. At that time, an average of 29% of Estonian residents aged from 16 to 64 consumed alcohol at least once a week. The prevalence of excess body weight can be examined through the total share of overweight (KMI3 = 25,0–29,9 kg/m2) and obese (KMI ≥ 30,0 kg/m2) adults in the population, and this has consistently increased over time. Meanwhile, the increase in the share of adults engaged in recreational sports indicates that general awareness of the importance of healthy behaviours has grown. Although the opposite trajectories of these two indicators may come as somewhat unexpected, they illustrate, on the one hand, the versatility of health determinants and, on the other hand, the differences in health behaviour between population groups. The increase in the proportion of overweight and obese people in the general population does not necessarily indicate a similar trend among those who have increased their physical activity.
Since the changes in the time series of these indicators at least partially overlap with several significant events or stages for Estonia, the following analysis will look at four distinct periods. The period from 1990 to 1996 marks a time of social transition and also reflects the greatest relative change in the prevalence of stress. The period from 1998 to 2004 covers transformative years for Estonia’s development, including the economic crisis of 1998 and the country’s accession to the European Union and NATO in 2004. The period from 2006 to 2012 follows the years of rapid economic growth and the severe economic crisis that followed, while the last period (from 2014 to 2020) is distinguished by the COVID-19 pandemic that reached Estonia in the spring of 2020 (at the time of data collection).
Analysing the associations presented in in Figure 2.3.2 shows that the discussed health behaviour indicators are associated with higher stress levels, but the strength of the association (and its statistical significance) varies from period to period. While the adjusted model covering the whole period shows that, compared to occasional smokers and non-smokers, daily smokers have 1.3 times the odds of having higher stress levels, the same odds ratio was the lowest and statistically non-significant for the period from 1990 to 1996, which had the highest prevalence of daily smokers. In all subsequent periods, however, daily smoking was associated with higher stress levels. For alcohol, the model spanning the entire period showed that drinking once a week or more was associated with 1.2 times the odds of greater stress compared to drinking alcohol less frequently. This relationship has been statistically significant since 2006. When it comes to body weight, the most conspicuous risk factor for stress is obesity. The subgroup of obese people had 1.2 times the odds of experiencing stress as adults with normal weight. However, if we look at this relationship across the different periods, the relationship between obesity and high stress levels was statistically significant only in the last two periods. A similar relationship appeared in connection to recreational sports. Adults who exercised less than once a week had approximately 1.2 times the odds of feeling stressed than those who exercised once a week or more. The odds ratio is the highest in the first period, while it is insignificant in the period from 1998 to 2004.
J2.3.2.R
maiko.koort
2023-07-09
library(ggplot2)

#faili sisselugemine ja andmete formaadi korrigeerimine
J232=read.csv("PT2-T2.3-J2.3.2.csv",header=TRUE, encoding ="UTF-8")
names(J232)=c("Faktor","Aeg","high","low","OR")


#joonis
ggplot(J232,aes(x=Aeg,y=OR,col=Aeg))+
  facet_grid(~Faktor,labeller = label_wrap_gen())+
  geom_point(cex=3)+
  geom_errorbar(aes(x=Aeg,ymin=low,ymax=high),width=0.2,linewidth=0.9)+
  geom_abline(slope=0,intercept=1,linewidth=0.3)+
  theme_minimal()+
  theme(legend.title=element_blank())+
  theme(legend.position = "none")+
  scale_y_continuous(limits=c(0.5,2.5),breaks=seq(0,3,0.5))+
  ylab("Odds ratio (OR) and 95% confidence interval")+
  xlab("")+
  theme(axis.text.x = element_text(angle = 90))+
  scale_color_manual(values=c("#6666cc","#668080","#f09d00","#FF3600"))+
  theme(text = element_text(color="#668080"),axis.text=element_text(color="#668080"))+
  theme(strip.text.y = element_text(angle = 360,color="#668080"),strip.text.x=element_text(color="#668080"))
Although the association between adult health behaviours and mental health has changed over the past 30 years, there is a clear pattern that less-health-promoting behaviours are associated with poorer mental health. But does this association also vary across different population groups? Figure 2.3.3 presents the results of adjusted logistic regression analysis stratified by gender, ethnicity and education on health behaviour indicators and stress characteristics in the Health Behaviour among Estonian Adult Population survey aggregate dataset from 1990 to 2020.
J2.3.3.R
maiko.koort
2023-07-09
library(ggplot2)
library(tidyr)
library(scales)

#faili sisselugemine ja andmete formaadi korrigeerimine
J233=read.csv2("PT2-T2.3-J2.3.3.csv",header=TRUE, encoding ="UTF-8")
names(J233)=gsub("X", "",  names(J233))
J233$OR=as.numeric(J233$OR)
J233$`95..CI..high`=as.numeric(J233$`95..CI..high`)
J233$`95..CI..low`=as.numeric(J233$`95..CI..low`)
J233$Faktor=as.factor(J233$Faktor)
J233$Grupp=as.factor(J233$Grupp)
J233$Faktor=factor(J233$Faktor,levels(J233$Faktor)[order(c(2,1,3,4))])
J233$Grupp=factor(J233$Grupp,levels(J233$Grupp)[order(c(5,3,6,2,4,1))])


#joonis
ggplot(J233,aes(x=Grupp,y=OR))+
  geom_point(aes(col=Grupp),cex=3)+
  facet_grid(~Faktor,labeller = label_wrap_gen(15))+
  geom_errorbar(aes(x=Grupp, ymin=`95..CI..low`,ymax=`95..CI..high`, col=Grupp),width=0.2,linewidth=0.9)+
  geom_abline(intercept=1,slope=0)+
  theme_minimal()+
  theme(legend.title=element_blank())+
  ylab("Odds ratio (OR) and 95% confidence interval")+
  xlab("")+
  scale_y_continuous(limits=c(0.75,1.75))+
  theme(axis.text.x = element_text(angle = 90),legend.position = "none")+
  scale_color_manual(values=c("#FF3600","#6666cc","#668080","#668080","#668080","#668080"))+
  theme(text = element_text(color="#668080"),axis.text=element_text(color="#668080"))+
  theme(strip.text.y = element_text(angle = 360,color="#668080"),strip.text.x=element_text(color="#668080"))
While daily smoking predicted higher stress levels for both women and men, some differences appeared when adjusting for ethnicity and education. Daily smoking was statistically significantly associated with higher stress in Estonians (but not in residents of other ethnicities) and in the group with basic education (but not higher education). While both men and women who consumed alcohol once a week or more had greater odds of having higher stress levels, the odds ratio (OR 1,10 vs. 1,33) was significantly higher in women. Regarding ethnicity, the association was significant only in Estonians, which is at least partially accounted for by the higher occurrence of this pattern of alcohol consumption (28% of Estonians and 18% of other nationalities). With smoking, the relationship with stress was statistically significant in the group with lower education. With alcohol consumption, by contrast, the relationship was significant in the group with higher education, where frequent alcohol consumption increased the odds of experiencing stress by 1.26 times.
Overweight men had slightly increased odds of experiencing greater stress (OR 1.17) than men with normal BMI, while the association was not statistically significant in women. Similar effect sizes were found for Estonians (OR 1.14) and adults with higher education (OR 1.24). Regarding recreational sports, the relationship with stress was significant in both women and men, but differences emerged when adjusting for ethnicity and education. Estonians who rarely engaged in recreational sports had 1.23 times the odds of experiencing more stress as those who participated in recreational sports once a week or more frequently. In contrast, participation in recreational sports did not predict perceived stress among non-Estonians. The same was true for the educational variable: adults with higher education had a corresponding odds ratio of 1.37, while there was no difference in those with basic education.
Judging by these results, it is safe to conclude that while the lifestyle factors affecting perceived stress are generally similar in men and women, the relationship varies significantly when adjusting for ethnicity and educational level. Therefore, the relationships between health behaviour and mental health are not necessarily identical across all population groups.
Previous analysis explored the association between lifestyle and stress using the 30-year aggregate dataset of the Health Behaviour among Estonian Adult Population survey. More detailed insights on the possible links between various mental health indicators and health behaviour can be obtained using the most recent data from spring of 2020 (Reile and Veideman 2021), which assessed mental health based on self-reported stress, depression, fatigue and suicidal ideation. According to the weighted data, i.e. data adjusted to be representative of Estonia’s 16-64-year-old population, 21% of respondents reported excessive stress. The study defined ‘depressiveness’ as feeling more low-spirited or miserable than usual in the past 30 days. Twenty-two percent of the respondents experienced depressiveness. Forty-three percent of people reported feeling fatigued all the time or quite often, and 18% of adults had had suicidal thoughts within the past 12 months or before. Since data collection for the survey began in March 2020, these indicators are no doubt affected by the first wave of the COVID-19 pandemic.
The following regression analysis assesses the links between these mental health indicators and a series of sociodemographic and health behaviour indicators.
After adjustment for demographic variables (Figure 2.3.4) the analysis reveals an interesting variation between health behaviour and mental health problems. The results show that an irregular diet strongly predicts mental health problems. Compared to respondents with more regular diets, those who skipped meals more than two days a week had greater odds (OR 1.39–1.60) of experiencing all the mental health problems discussed. Additionally, frequent consumption of sugary foods (6–7 days a week v. less frequently) was associated with both suicidal ideation (OR 1.54) and fatigue (OR 1.39). Body weight and physical activity indicators were associated with stress, fatigue and depressiveness but not with suicidal ideation. For example, compared to respondents of normal weight, obese subjects were more likely to experience fatigue (OR 1.31) and depressiveness (OR 1.35). Adults who participated in recreational sports less than once a week had greater odds of experiencing stress (OR 1.46) or depressiveness (OR 1.36) or fatigued (OR 1.43) than those who regularly participated in recreational sports. The relationship with longer screen time was statistically significant only in the depressiveness model (OR 1.33).
Indicators of risk behaviour were associated with stress, fatigue and suicidal ideation but not with depressiveness. Fatigue was predicted by both daily smoking (OR 1.31 compared to occasional or no smoking) and alcohol consumption 4–7 days a week (OR 1.43 compared to less frequent drinkers). Frequent alcohol and drug use were also strongly associated with stress and suicidal ideation. With alcohol and drug use, the odds ratios are noteworthy: frequent alcohol use and drug use resulted in respectively 2.52 and 2.18 times higher odds for having suicidal thoughts compared to reference levels.
J2.3.4.R
maiko.koort
2023-07-09
library(ggplot2)
library(tidyr)
library(scales)

#faili sisselugemine ja andmete formaadi korrigeerimine
J234=read.csv2("PT2-T2.3-J2.3.4.csv",header=TRUE, encoding ="UTF-8")
J234$X[1]="Drugs within 12 months"
J234$X[2]="Alcohol 4–7 days a week"
J234x=J234[1:8,]
J234y=J234[9:24,]

J234x=pivot_longer(J234x,2:5)
J234y=pivot_longer(J234y,2:5)
J234y$value=as.numeric(J234y$value)
J234x$high=J234y$value[1:32]
J234x$low=J234y$value[33:64]
J234=J234x
J234$value=as.numeric(J234$value)
J234$X=as.factor(J234$X)
J234$X=factor(J234$X,levels(J234$X)[order(c(2,8,4,3,6,7,5,1))])
J234$name=as.factor(J234$name)
J234$name=factor(J234$name,levels(J234$name)[order(c(3,1,4,2))])


#joonis
ggplot(J234,aes(x=X,y=value,col=name))+
  geom_point(pos=position_dodge(0.8),cex=3)+
  geom_errorbar(aes(ymin=value-low,ymax=value+high,col=name),width=0.3,pos=position_dodge(0.8),linewidth=0.9)+
  geom_abline(intercept=1,slope=0)+
  coord_flip()+
  theme_minimal()+
  theme(legend.title=element_blank())+
  ylab("")+
  xlab("")+
  theme(axis.text.x = element_text(angle = 90),legend.position = "bottom")+
  theme(text = element_text(color="#668080"),axis.text=element_text(color="#668080"))+
  scale_color_manual(values=c("#668080","#FF3600","#f09d00","#6666cc"),breaks = rev(levels(J234$name)))
In addition to associations between these individual factors, certain patterns are likely to emerge when looking at lifestyle on the whole. Being physically active usually means also monitoring one’s diet and refraining from activities harmful to one’s health. The same can be assumed for health-damaging behaviour, where the accumulation of risks can lead to more negative health outcomes. The following examines this situation based on the example of a summary index of the eight health behaviour indicators previously discussed.4. While a quarter of Estonian adults aged 16 to 64 were not exposed to any health behaviour risk factors, and slightly over half were exposed to 1 or 2 factors, every fifth respondent was exposed to 3 or more risk factors.
Figure 2.3.5 opresents odds ratios adjusted for demographic and socioeconomic factors for associations between multiple concurrent risk factors and mental health indicators.
Compared to respondents who were not exposed to any risk factors, those exposed to one or two behavioural risk factors had 1.5 times the odds of experiencing stress, depression, fatigue and suicidal thoughts. However, in the presence of three or more risk factors, the corresponding odds ratios for all mental health indicators are more than 2.5 times as great. Therefore, the higher the behavioural risk, the higher the likelihood of having mental health problems.
J2.3.5.R
maiko.koort
2023-07-09
  library(ggplot2)

  #faili sisselugemine ja andmete formaadi korrigeerimine
  J235=na.omit(read.csv("PT2-T2.3-J2.3.5.csv",header=TRUE, encoding ="UTF-8"))
  J235$X[2:4]=J235$X[1]
  J235$X[6:8]=J235$X[5]

  names(J235)=c("X","Faktor","high","low","OR")
  J235$X=as.factor(J235$X)
  J235$Faktor=as.factor(J235$Faktor)
  J235$X=factor(J235$X,levels(J235$X)[order(c(2,1))])
  J235$Faktor=factor(J235$Faktor,levels(J235$Faktor)[order(c(2,4,1,3))])


  #joonis
  ggplot(J235,aes(x=Faktor,y=OR,col=Faktor))+
    facet_grid(~X,labeller = label_wrap_gen())+
    geom_point(cex=3)+
    geom_errorbar(aes(x=Faktor,ymin=low,ymax=high),width=0.1,linewidth=0.9)+
    geom_abline(slope=0,intercept=1,linewidth=0.3)+
    theme_minimal()+
    theme(legend.title=element_blank())+
    theme(legend.position = "none")+
    scale_y_continuous(limits=c(1,4.5),breaks=seq(0,4.5,0.5))+
    ylab("Odds ratio (OR) and 95% confidence interval")+
    xlab("")+
    theme(axis.text.x = element_text(angle = 90))+
    theme(text = element_text(color="#668080"),axis.text=element_text(color="#668080"))+
    scale_color_manual(values=c("#668080","#FF3600","#f09d00","#6666cc"))+
    theme(strip.text.x=element_text(color="#668080"))
Lower socioeconomic status is generally associated with poorer health.
This pattern also applies to mental health in Estonian data (vt Figure 2.3.6), where an analysis based on the respondents’ gender, age, ethnicity, marital status and health behaviour indicators showed that both non-working respondents and those with lower education and income levels had higher odds of experiencing mental health problems. Although the associations varied across mental health indicators, the most notable relative differences occurred for income. For example, variation in the odds of having suicidal thoughts was nearly 2.5-fold between the lowest and highest income groups. One explanation for these expected associations is that people with lower social status experience more chronic stressors, immediate coping difficulties, and more often negative life events.
J2.3.6.R
maiko.koort
2023-07-09
library(ggplot2)
library(tidyr)
#faili sisselugemine ja andmete formaadi korrigeerimine
J236=read.csv("PT2-T2.3-J2.3.6.csv",header=FALSE, encoding ="UTF-8")
J236x=J236[1:7,1:5]
J236y=J236[10:16,1:5]
J236z=J236[19:25,1:5]

J236y[,1]=J236x[,1]
J236z[,1]=J236x[,1]

names(J236x)=c("X","Suicidal ideation","Fatigue","Depressiveness", "Stress")
names(J236y)=c("X","Suicidal ideation","Fatigue","Depressiveness", "Stress")
names(J236z)=c("X","Suicidal ideation","Fatigue","Depressiveness", "Stress")

J236x=pivot_longer(J236x,2:5)
names(J236x)=c("X","Faktor","value")

J236y=pivot_longer(J236y,2:5)
names(J236y)=c("X","Faktor","high")

J236z=pivot_longer(J236z,2:5)
names(J236z)=c("X","Faktor","low")

J236=cbind(J236x,J236y$high,J236z$low)
names(J236)[4:5]=c("high","low")

J236$value=as.numeric(J236$value)
J236$low=as.numeric(J236$low)
J236$high=as.numeric(J236$high)

J236$X=as.factor(J236$X)
J236$X=factor(J236$X,levels(J236$X)[order(c(6,5,4,3,7,1,2))])
J236$Faktor=as.factor(J236$Faktor)
J236$Faktor=factor(J236$Faktor,levels(J236$Faktor)[order(c(3,1,4,2))])

#joonis
ggplot(J236)+
  geom_point(aes(x=X,y=value,col=Faktor),cex=3,pos=position_dodge(0.8))+
 # geom_label(aes(x=X,label=value,col=Faktor,y=value-low-0.3),size=3,pos=position_dodge(0.8))+
  geom_errorbar(aes(x=X,ymin=value-low,ymax=value+high,col=Faktor),width=0.4,linewidth=0.7,pos=position_dodge(0.8))+
  geom_abline(slope=0,intercept=1,linewidth=0.3)+
  theme_minimal()+
  coord_flip()+
  theme(strip.text.y = element_text(angle = 360),legend.position = "bottom",legend.title=element_blank())+
  ylab("")+
  xlab("")+
  scale_y_continuous(limits=c(0,4.5),breaks=seq(0,4.5,0.5))+
  scale_color_manual(values=c("#6666cc","#668080","#f09d00","#FF3600"),breaks=rev(levels(J236$Faktor)))+
  theme(strip.text.x=element_text(color="#668080"))+
  theme(text = element_text(color="#668080"),axis.text=element_text(color="#668080"))+
  guides(color = guide_legend(nrow=2,byrow = TRUE))
While the above confirms that socioeconomic inequality is clearly manifested in mental health indicators, lower socioeconomic status, in turn, increases the risk of health-damaging behaviour. Smoking, which is one of the leading behavioural factors causing health loss, is a good example. In 2000, the share of daily smokers among Estonian adults with basic education was 40%, while this figure was just 16% among Estonian adults with higher education. In 20 years, however, this almost 2.5-fold difference between education levels has grown to a more than 4-fold difference.
In an analysis of associations that also took into account the effects of other demographic variables, the educational variation in daily smoking was even greater: compared to respondents with higher education, those with basic or lower education had 8.8 times the odds of being daily smokers. Similar socioeconomic patterns emerged with several other health behaviour indicators. For example, the difference between respondents with the lowest education and those with higher education was more than threefold (OR 3.60) in the model predicting participation in recreational sports and more than double (OR 2.07) in the model predicting obesity. here is another aspect to the health effects of inequality: lower socioeconomic status can also mean a lower probability of health behaviour change. While this association may not be universal, overweight adults with higher education had 1.45 times the odds of increasing their physical activity compared to overweight adults with basic education (Reile and Leinsalu 2019).
The accumulation of factors related to unfavourable socioeconomic status also increases the risk of mental health problems. When the variables of education level, income and employment status were combined into a sum index of low socioeconomic status (containing at least two elements from the following: primary or lower education level, belonging to the lowest income quartile, being unemployed) and correlations between low socioeconomic status and mental health outcomes were examined, it was clear that deprivation was strongly associated with mental health outcomes (see Figure 2.3.7). Without behavioural risk factors, deprivation was associated with only the variables of depressiveness and suicidal ideation However, when behavioural risk factors are present, the association between lower socioeconomic status and mental health vulnerability becames very noticeable.
J2.3.7.R
maiko.koort
2023-07-09
library(ggplot2)
library(tidyr)
#faili sisselugemine ja andmete formaadi korrigeerimine
J237=read.csv2("PT2-T2.3-J2.3.7.csv", encoding ="UTF-8")
J237x=J237[1:3,]
J237y=J237[5:7,]
J237z=J237[9:11,]

names(J237x)=names(J237)
names(J237y)=names(J237)
names(J237z)=names(J237)

J237x=pivot_longer(J237x,2:5)
J237y=pivot_longer(J237y,2:5)
J237z=pivot_longer(J237z,2:5)
J237=cbind(J237x,J237y$value,J237z$value)
names(J237)[4:5]=c("high","low")

J237$value=as.numeric(J237$value)
J237$low=as.numeric(J237$low)
J237$high=as.numeric(J237$high)

J237$X=as.factor(J237$X)
J237$X=factor(J237$X,levels(J237$X)[order(c(3,1,2))])
J237$name=as.factor(J237$name)
J237$name=factor(J237$name,levels(J237$name)[order(c(3,1,4,2))])

#joonis
ggplot(J237,aes(x=name,y=value))+
  facet_grid(X~.,labeller = label_wrap_gen())+
  geom_point(aes(col=name),cex=3)+
  geom_label(aes(label=value,col=name,y=value-low-0.3),size=3)+
  geom_errorbar(aes(x=name,ymin=value-low,ymax=value+high,col=name),width=0.2,linewidth=0.9)+
  geom_abline(slope=0,intercept=1,linewidth=0.3)+
  theme_minimal()+
  coord_flip()+
  theme(strip.text.y = element_text(angle = 360),legend.position = "none")+
  ylab("")+
  xlab("")+
  scale_y_continuous(limits=c(0,7),breaks=seq(0,7,0.5))+
  theme(text = element_text(color="#668080"),axis.text=element_text(color="#668080"))+
  scale_color_manual(values=c("#6666cc","#f09d00","#FF3600","#668080"))
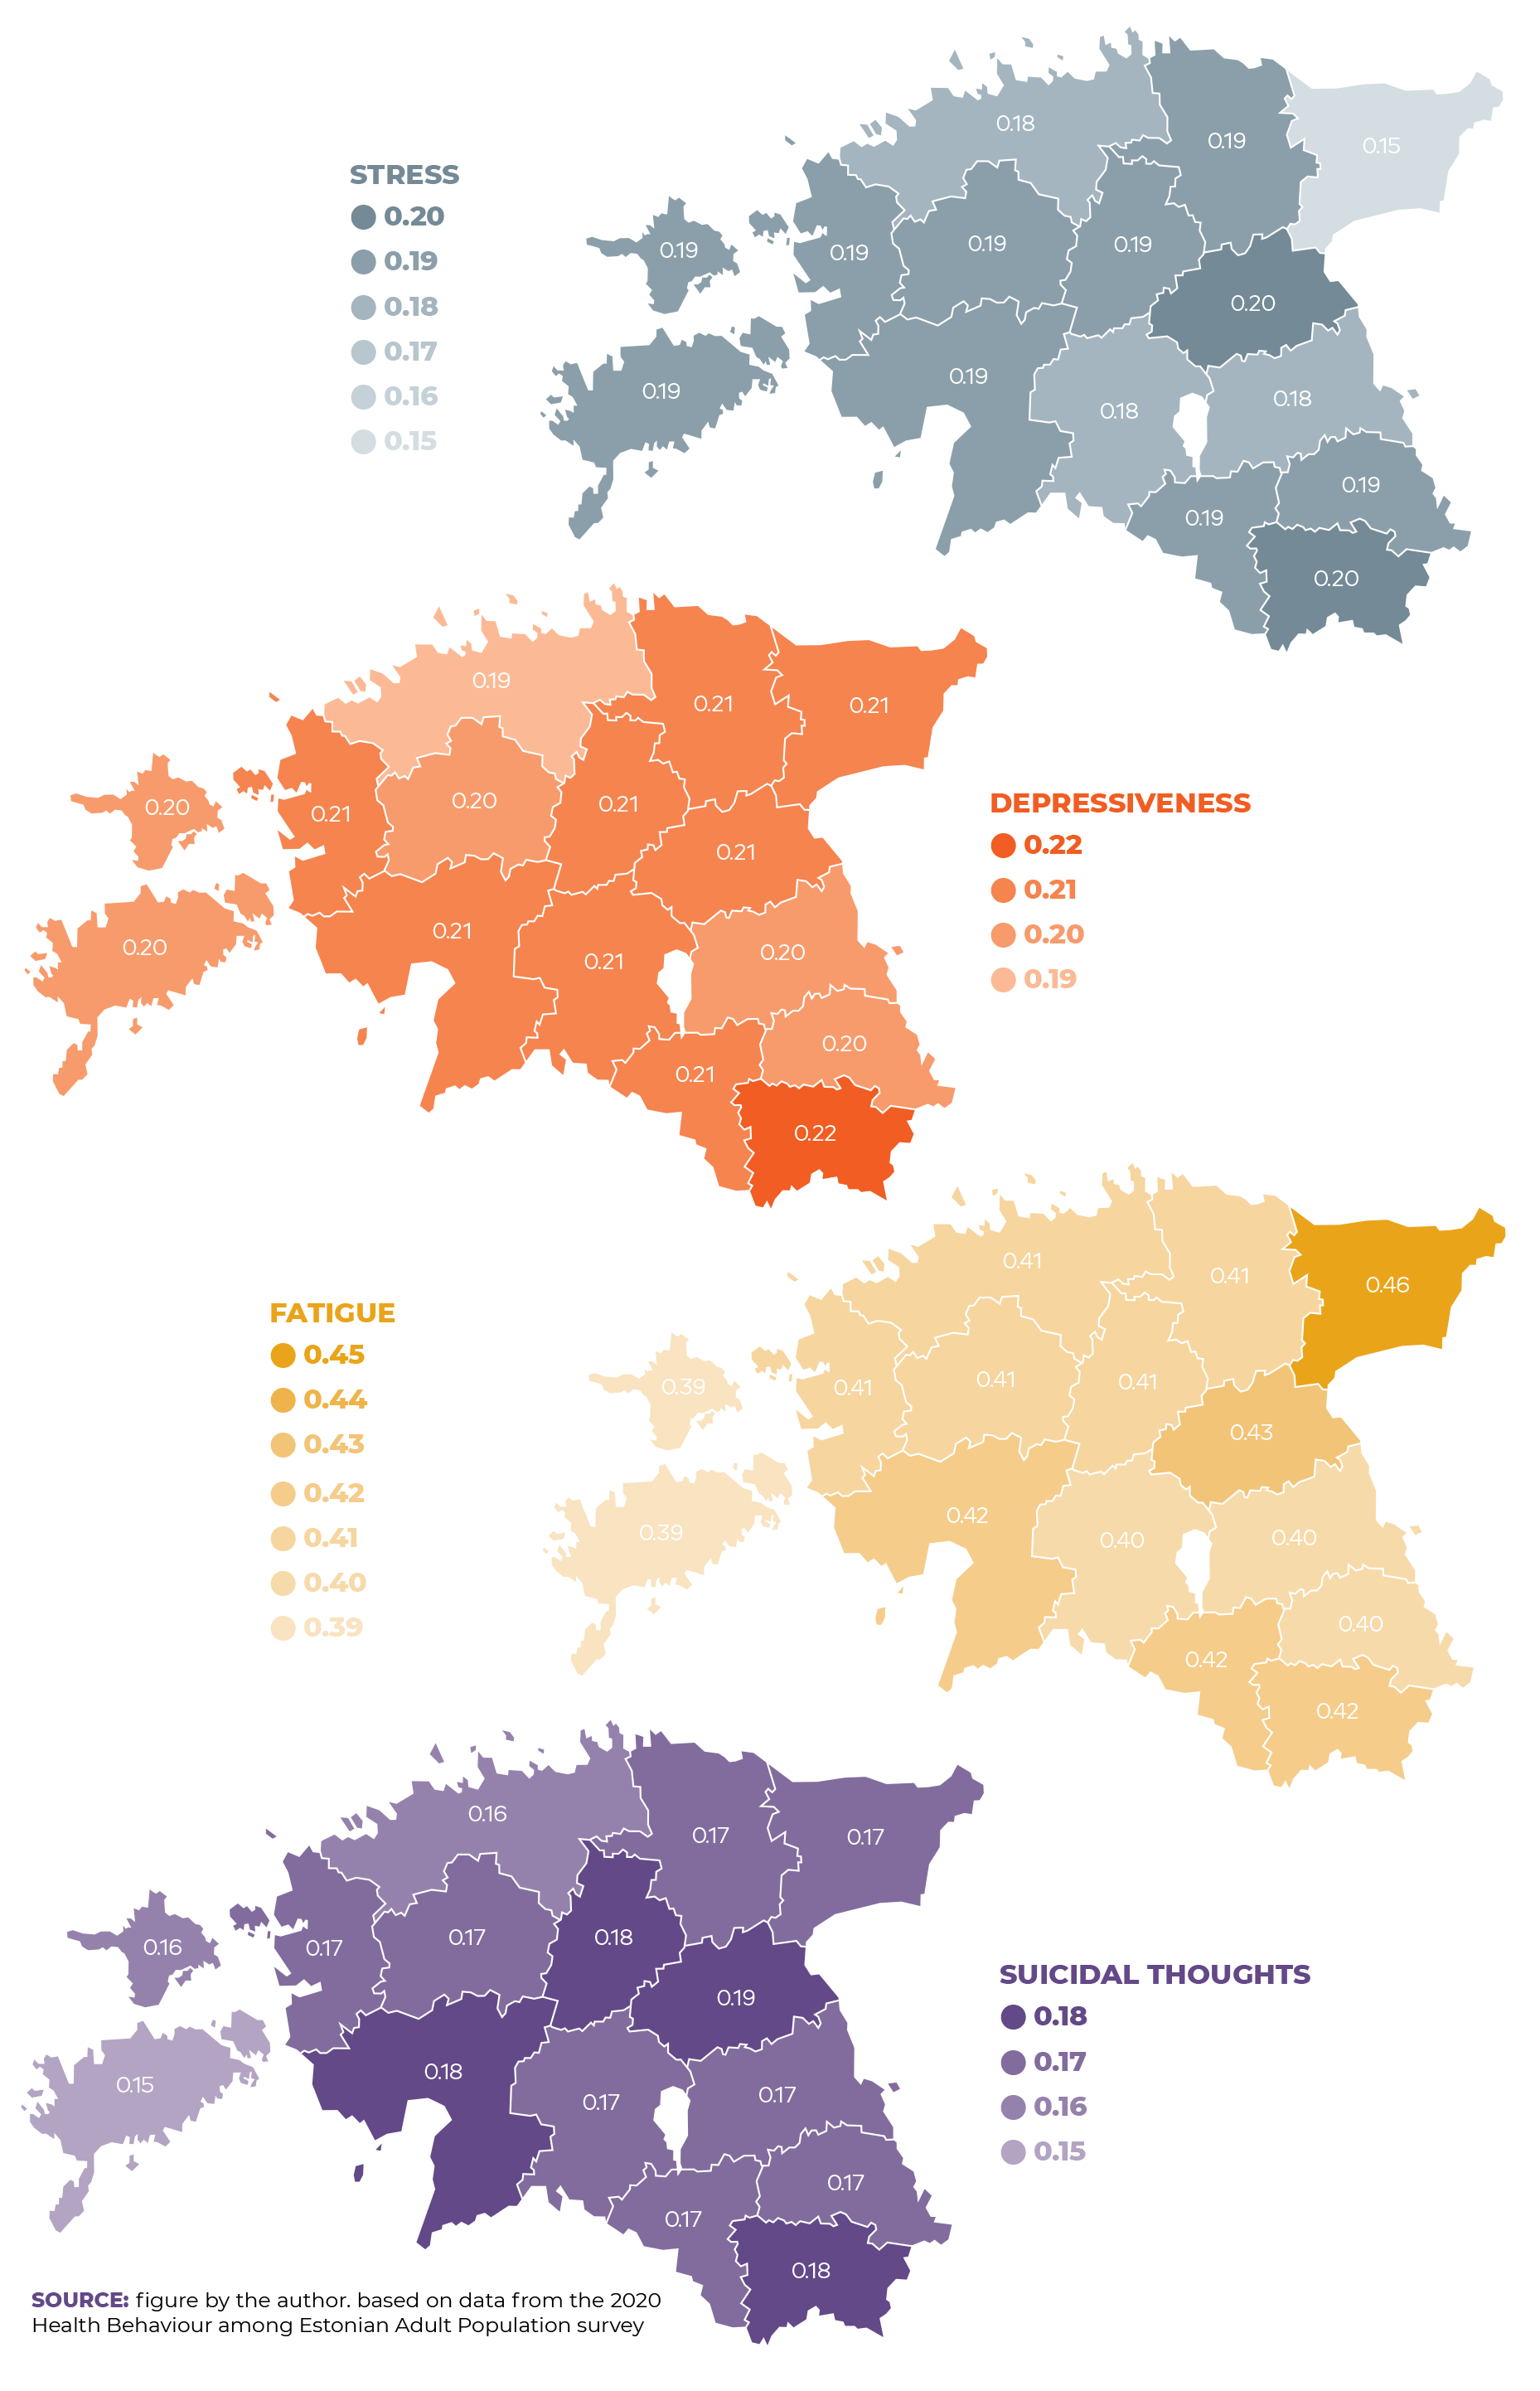
Additional variation in mental health indicators emerged between regions. Figure 2.3.8 presents the probabilities of the occurrence of mental health problems by county. These have been adjusted for demographic, socioeconomic and lifestyle factors5. Although there were only marginal regional variation in mental health indicators (taking demographic, socioeconomic and health behaviour indicators into account) as a whole, compared to Harju County, the probability of experiencing stress was statistically significantly (p < 0.05) higher in Jõgeva and Pärnu counties, and correspondingly lower in Ida-Viru County. The probability of experiencing depressiveness was higher in Jõgevamaa County, while only adults in Ida-Virumaa County were more likely to feel fatigued than those in Harjumaa County.
Summary
Health behaviours and mental health are closely correlated in adults. Although a closer inspection reveals differences between groups, it is generally true that behavioural patterns less supportive of overall health usually also indicate poorer mental health. Over time, the relationship between health behaviour and mental health factors has grown stronger. The trends in health behaviour and perceived stress presented in the time series reflect broader changes in society and the general way of life, supporting the hypothesis that health behaviour and mental health are shaped by the interplay of resources provided by the surrounding environment and individual behavioural choices and opportunities.
A closer look at health behaviour indicators revealed that diet, body weight and physical activity, as well as risk behaviour, were strongly associated with mental health indicators.
While for most individual indicators the associations varied depending on which aspect of mental health was assessed, an irregular diet was associated with increased odds of experiencing mental health problems in all models. In addition, the analysis showed that the accumulation of behavioural risks can lead to more negative health outcomes. In the presence of three or more concurrent health behaviour risk factors, the odds ratios for all mental health indicators increased more than 2.5-fold.
While the above suggests that increased risk behaviour indicates a higher probability of mental health problems, demographic and socioeconomic variation must also be considered. In self-reported data, mental health problems were more common in women and younger age groups. However, the analysis showed that mental health problems were also significantly more common among groups with lower income. ÜLower socioeconomic status increased the risk of both health-damaging behaviour and mental health problems. This was particularly evident in the analysis stratified by risk behaviour, where low socioeconomic status was associated with more than twice the odds of experiencing multiple mental health problems even when no behavioural risk factors were present.
Some differences in mental health indicators were also found between regions, but these variations by county in the mean values of stress, fatigue, depressiveness and suicidal ideation were generally modest.
Therefore, the lifestyle and mental health of adults are clearly associated. SHowever, the complex patterns of inequality expressed in this relationship highlight the need to treat health as a resource that is not uniformly distributed. The various ways in which our surrounding environments produce individual differences in health raise the question: how much of our lifestyle is shaped by our own choices, and how much of it is shaped by the opportunities provided for us? The answer to this question will determine whether and how we can prevent and alleviate public health problems related to risk behaviour and mental health in society.
Alwan, A., MacLean, D. R., Riley, L. M., d’Espaignet, E. T., Mathers, C. D., Stevens, G. A., & Bettcher, D. (2010). Monitoring and surveillance of chronic non-communicable diseases: progress and capacity in high-burden countries. The Lancet, 376(9755), 1861–1868. https://doi.org/10.1016/S0140-6736(10)61853-3
Reile, R., & Leinsalu, M. (2019). Factors associated with improving diet and physical activity among persons with excess body weight. European Journal of Public Health, 29(6), 1166–1171. https://doi.org/10.1093/eurpub/ckz170
Reile, R., & Veideman, T. (2021). Eesti täiskasvanud rahvastiku tervisekäitumise uuring 2020. https://www.tai.ee/sites/default/files/2021-04/TKU2020_kogumik.pdf