Mental health and well-being in the learning environment
In Estonia, people often ask why children lose interest in learning at school and what aspects of our school environment1 helps children learn and feel good about learning. According to self-determination theory (Ryan and Deci 2000)), one of the most influential theories in this field, (learning) motivation and well-being are supported by the satisfaction of three universal psychological needs: autonomy (the ability to act independently), competence or self-efficacy (the success of actions) and relatedness (the existence and quality of relationships). To support students’ autonomy, they must be able to take responsibility for their own learning, which requires information, meaningful choices and interesting tasks. The exercise of autonomy is hindered by a controlling environment (both marks and punishments can serve as a means of control), where the teacher cannot understand the student. Contributing to self-efficacy is the student’s desire to develop in a supportive environment where students can test themselves and receive constructive feedback on their performance. Positive relationships with fellow students and teachers help create and maintain a sense of relatedness at school.
Internationally, it has been estimated that 10–20% of students suffer from mental health problems and poor well-being (Kieling et al. 2011) and that one in two adult mental health problems started before the age of 14 (Choi 2018). The OECD Programme for International Student Assessment PISA has revealed that anxiety and depressiveness have increased, while bullying at school and suicides have decreased internationally among 15-year-olds in the past few decades (Burns and Gottschalk 2019).
Along with the home, the school environment plays a key role in children’s wellbeing, as well as mental health and performance.
comes with self-realisation and meaningful development and is related to learning motivation.
We proceed from the understanding of self-determination theory that there is a connection between learning motivation and wellbeing and that wellbeing at school is about more than just having fun and feeling comfortable. It is a subjectively perceived experience that comes with self-realisation and meaningful development. A learning environment that supports learning and wellbeing – described in Estonia as a modern approach to learning> – was among the goals of the lifelong learning strategy for 2020 and emphasised in the vision document for education Smart and Active Estonia 2035. >. Its implementation is monitored, among other ways, through the National Satisfaction and School Environment Survey (referred to below as the national satisfaction survey2).
Children’s wellbeing as students reflects their perceived school experience, relationships and sense of wellbeing at school. According to the International Survey of Children’s wellbeing (ISCWeB)3 a majority (77%) of 10-year-old children in Europe are very satisfied with their life as a student (more than 8 points on a scale of 0–10, Figure 3.3.1). The wellbeing of 10-year-old Estonian children is close to the average of the studied European countries. As a general trend, children’s perceived wellbeing decreases with age: among 12-year-olds, about one-tenth fewer respondents are very satisfied with their life as a student than among 10-year-olds. Compared to other countries, Estonia’s decline in wellbeing ratings is one of the largest: nearly 20%. Twelve per cent of 10-year-olds and 19% of 12-year-olds are not satisfied with their life as a student in Estonia (ratings of 0–4 on the same scale).
J3.3.1.R
maiko.koort
2023-07-12
library(ggplot2)
library(tidyr)
library(tibble)

#faili sisselugemine ja andmete formaadi korrigeerimine
J331=read.csv("PT3-T3.3-J3.3.1.csv",header=TRUE, encoding ="UTF-8")
names(J331)[2:3]=c("10-year-olds","12-year-olds")
J331$Riik[J331$Riik=="Eesti"]="EESTI"

levels=reorder(J331$Riik,J331$`10-year-olds`)
J331=pivot_longer(J331,2:3,"Vanus")
J331$Riik=as.factor(J331$Riik)
J331$Vanus=as.factor(J331$Vanus)
J331$Riik=factor(J331$Riik,rev(levels))
J331$Vanus=factor(J331$Vanus,levels(J331$Vanus)[order(c(2,1))])
font=rep(1,16)
font[9]=2

#joonis
ggplot(J331)+
  geom_col(aes(x=Riik,y=value,fill=Vanus),pos=position_dodge(0.8),width=0.6)+
  theme_minimal()+
  theme(legend.position = "bottom")+
  coord_flip()+
  scale_fill_manual(values=c("#FF3600","#0069AD"),breaks=c("10-year-olds","12-year-olds"))+
  theme(text = element_text(color="#668080"),axis.text=element_text(color="#668080"))+
  scale_y_continuous(limits=c(0,100),breaks=c(0,25,50,75,100))+
  theme(legend.title = element_blank(),axis.text.y = element_text(face=font))+
  ylab("%")+
  xlab("")
## Warning: Vectorized input to `element_text()` is not officially supported.
## ℹ Results may be unexpected or may change in future versions of ggplot2.
In Estonia, one of the reasons for the decline in school-related wellbeing may be that children in this age range are moving to a higher school level. There, instead of one class teacher, the student has several different subject teachers, and the contact (relatedness) between the student and the teacher decreases. Furthermore, the formative assessment that was used in primary school is not being used at higher school levels, but marks are becoming important, and many students find this stressful. The amount of homework is also changing. According to the national satisfaction survey, this is a problem for almost every third student in the 8th and 11th grades but only for 13% in the 4th grade. Perception of the amount of homework is related to wellbeing at school.
higher in the fourth grade, bottoms out in the eighth grade, increases in upper secondary school, and is again higher among adult students in upper secondary school.
The results of the national satisfaction survey in 2021 (Figure 3.3.2) reveal that the change in students’ school-related wellbeing, when mapped out, is U-shaped: perceived wellbeing is the highest in the fourth grade, bottoms out in the eighth grade, increases again in upper secondary school, and is again the highest among adult students in upper secondary school. The increase in perceived wellbeing at the upper secondary school level can be explained by an increase in conscious learning and appreciation for learning by that time. Moreover, significantly less bullying has been observed at the upper secondary school level.
J3.3.2.R
maiko.koort
2023-07-12
library(ggplot2)
library(tidyr)
library(tibble)

#faili sisselugemine ja andmete formaadi korrigeerimine
J332=read.csv("PT3-T3.3-J3.3.2.csv",header=TRUE, encoding ="UTF-8")[1:6,]
names(J332)=c("Faktor","4th grade","8th grade","11th grade","Upper secondary school for adults")
J332=pivot_longer(J332,2:5)
J332$Faktor=as.factor(J332$Faktor)
J332$name=as.factor(J332$name)
J332$name=factor(J332$name,levels(J332$name)[order(c(2,4,3,1))])
J332$Faktor=factor(J332$Faktor,levels(J332$Faktor)[order(c(5,4,6,2,1,3))])


#joonis
ggplot(J332)+
  geom_col(aes(x=Faktor,y=value,fill=name),pos=position_dodge(0.8),width=0.7)+
  theme_minimal()+
  theme(legend.position = "bottom")+
  coord_flip()+
  scale_fill_manual(values=c("#81DBFE","#F25D23","#38bf7b","#6666cc"),breaks=c("4th grade","8th grade","11th grade","Upper secondary school for adults"))+
  theme(strip.text.x=element_text(color="#668080"))+
  theme(text = element_text(color="#668080"),axis.text=element_text(color="#668080"))+
  scale_y_continuous(limits=c(0,4),breaks=c(0,1,2,3,4))+
  theme(legend.title = element_blank())+
  ylab("")+
  xlab("")
## Warning: Removed 1 rows containing missing values (`geom_col()`).
According to the national satisfaction survey, students are most satisfied with the physical aspects of the school environment (including the timetable, classrooms, and learning materials) and the valuing of learning in the classroom. Conversely, opportunities for movement (the opportunity to be physically active during breaks and during lessons) received the lowest scores at all age levels. Among the various aspects of modern approaches to learning, students most value receiving constructive feedback but feel that what they are learning does not relate enough to real life. Children in the fourth grade, where formative assessment is mostly used, are most satisfied with the feedback they receive. Both 8th- and 11th-grade students are more critical about the extent to which the school supports their autonomy, and they value self-efficacy and relationships with fellow students relatively highly (Figure 3.3.2).
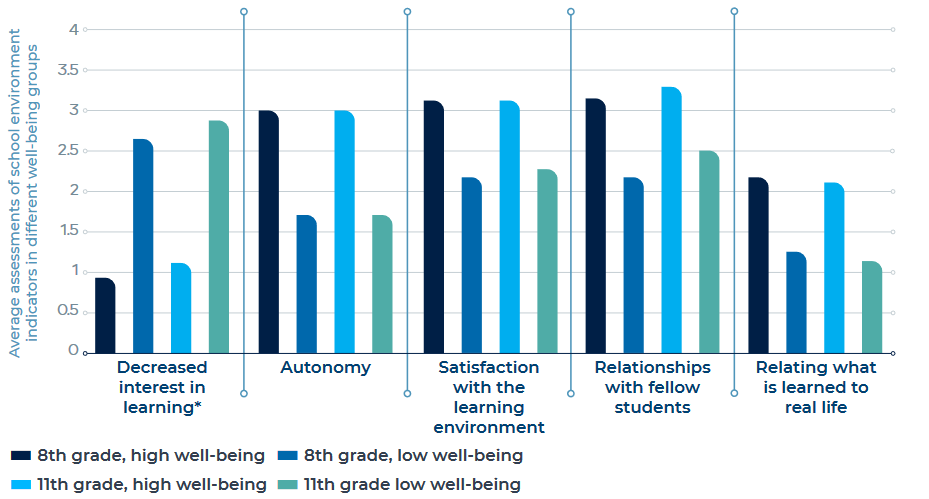
To find out which aspects of the learning environment have the greatest impact on students’ wellbeing at school, we use the responses of 8th- and 11th-grade students to the national satisfaction survey. Figure 3.3.3 shows the factors most strongly related to students’ wellbeing, which (for the sake of simplicity) are presented as averages, with a comparison between students of low and high perceived wellbeing. wellbeing is most strongly related to interest in learning, followed by autonomy and relationships. For eighth-grade students in particular, interest in learning is boosted if the teacher knows how to relate what is being taught to real life. All this supports a modern approach to learning, which prioritises solving vital tasks in a cooperative learning environment that takes into account the individuality of learners.
Among girls, there are more children who are very satisfied with their school life compared to boys; this difference disappears in the 11th grade. Girls of different ages complain more about school fatigue than boys, which may mean, among other things, that they feel more social pressure to achieve better results. Trying to meet expectations makes them anxious and stressed. Students with special needs rate their wellbeing and the learning environment at school lower than students without special needs do. The analysis showed that wellbeing did not vary according to the language of instruction, except in the 11th grade, where students studying in Estonian are slightly more satisfied with various aspects of the school environment and have higher wellbeing than students studying in Russian. While eighth-grade students are generally the most critical in their evaluations, students from small schools (up to 20 students per year) are more positive when evaluating various aspects of school life. In lower secondary schools with fewer children, the students are likely to have a closer relationship with the teacher (more personal contact and attention). In upper secondary school, the quality of education and the choices available at a large school are valued. Thus, students’ wellbeing and satisfaction with various aspects of the school environment are greater, according to the evaluations of the 11th-grade students at large schools (those with three or more parallel classes).
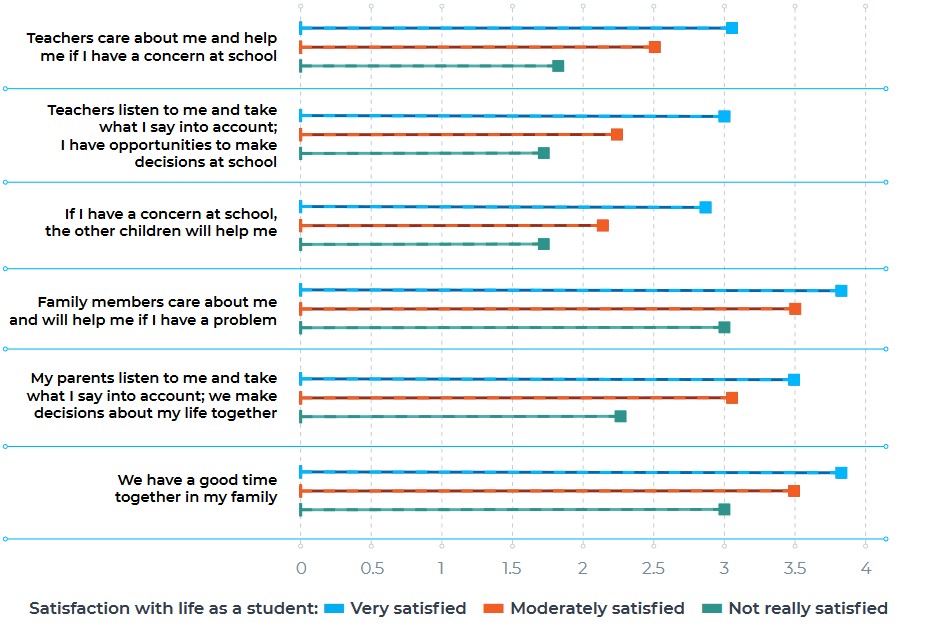
Relationships with fellow students and teachers form the core of the learning environment, which is continuously influenced by the student’s relationships at home. We compared groups of 12-year-old students who had low, medium and high satisfaction with school life (ISCWeB). The comparison showed that children who are very satisfied with school life consider their teachers to be caring and helpful and the school to be a very safe place (Figure 3.3.4). These children grow up in homes where they experience both autonomy (parents consider their opinion) and relatedness (the students perceive their parents as being very caring and spending a lot of time with them). Children who are not satisfied with their school life do not rate their relationships with teachers and fellow students particularly highly. Moreover, they experience less closeness and acceptance at home; in particular, they perceive little positive relatedness.
Although a general decline in school bullying has been noted internationally (Burns and Gottschalk 2019), bullying is still widespread among Estonian students, judging by the national satisfaction survey results. According to the PISA study, Estonia has slightly more bullying among 15-year-olds than OECD countries do on average. Nearly a quarter (23%) of fourth-grade students have experienced repeated bullying (including other students hitting them, mocking them, taking their things, insulting them and/or threatening them online). By the 8th grade, this proportion has shrunk to 13%, and by the 11th grade, it has shrunk to 5%. Compared to students who are not bullied, students who have experienced repeated bullying give a lower evaluation of both the learning environment and their wellbeing at school. Their relationships with peers often deteriorate, and their interest in learning decreases. For example, eighth-grade students are twice as likely to have little interest in learning and nearly four times as likely to be dissatisfied with their relations with other students if they have been repeatedly bullied. If the child does not feel safe at school or welcome among peers, and if the teachers do not notice and help the child in case of bullying, the child no longer wants to go to school. If no help is received at home, the child’s vulnerability and risk of developing mental health problems increases.
YOUNG ADULTS’ RECOLLECTIONS OF SCHOOL BULLYING
There was no big difference between girls and boys when it came to being violent. Rather, boys were more likely to hit, while girls were better at psychological violence. If you were especially unlucky, you would experience both.
I was the youngest child in my family, and both my brothers and my father had studied at the same school before me. The math teacher told me in the first lesson that my math mark would not be higher than a three [equivalent to a C]. With this knowledge, I had to study under this teacher for years. Since the teacher had their own opinion and it seemed impossible to change it, I just started skipping school and my math skills never improved.
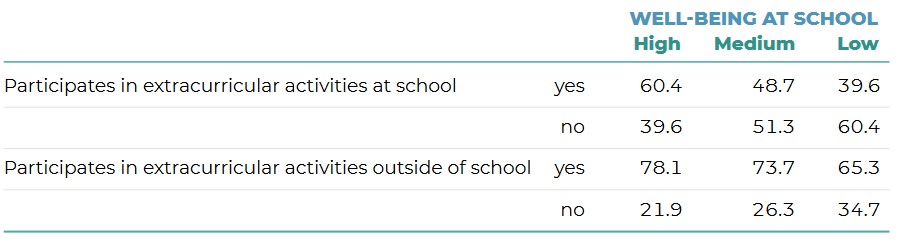
According to the national satisfaction survey, almost half of eighth-grade students (48%) participate in the school’s extracurricular activities (e.g. hobby clubs, organising events), and nearly three-quarters (71%) are involved in extracurricular activities outside the school (e.g. attending a hobby school, a youth centre or camp).
Those who participate in extracurricular activities feel they have greater autonomy, self-efficacy and positive relatedness and are usually more satisfied with their relationships with classmates. They have less school fatigue and more interest in learning. Extracurricular education can help compensate if, for example, a student who feels ill at ease or is bullied at school finds friends and supporters in extracurricular activities instead. A comparison of the groups of students with high, medium and low levels of wellbeing at school shows that 60% of students with high wellbeing participate in extracurricular activities at school, and the same proportion of students with low wellbeing at school do not (Table 3.3.1). However, extracurricular education outside of school is more uniformly supportive of children’s wellbeing.
The COVID-19 pandemic and the state of emergency in the spring of 2020 was a major change in the lives of all people. Students and teachers had to quickly adapt to distance learning, which tested students’ ability to self-manage and threatened their wellbeing. According to the 2021 national satisfaction survey, students’ wellbeing at school (a composite of the assessments ‘School is interesting’, ‘I feel good at school’ and ‘I usually enjoy going to school’) has not changed compared to 2019 and 2020 (all surveys were conducted in February). The perceived autonomy of fourth- and eighth-grade students has decreased, which is why in 2021, children responded that they could not learn as they wished and be ‘themselves’ at school. This result was expected in the context of the pandemic and the various restrictions associated with it. Additionally, school fatigue and decreased interest in learning are more of a problem for 8th- and 11th-grade students than for 4th-graders and adult learners. Children who receive little support from parents and teachers also experience greater fatigue and decreased interest in learning. However, loss of interest in learning is a risk factor for dropping out.
EXCERPTS FROM INTERVIEWS WITH STUDENTS DURING THE COVID-19 PANDEMIC
A sixth-grade girl: ‘I miss my friends. I feel like I haven’t seen them in
years. I miss school. I wish the virus would go away and I could go back
to school.’
A sixth-grade boy: ‘I really want to go back to school because there is
nothing to do at home.’
A sixth-grade boy: ‘I miss school and especially my friends. Schoolwork
also goes faster at school.’
A 12th-grade girl: ‘Life without friends between these walls is a disaster.’
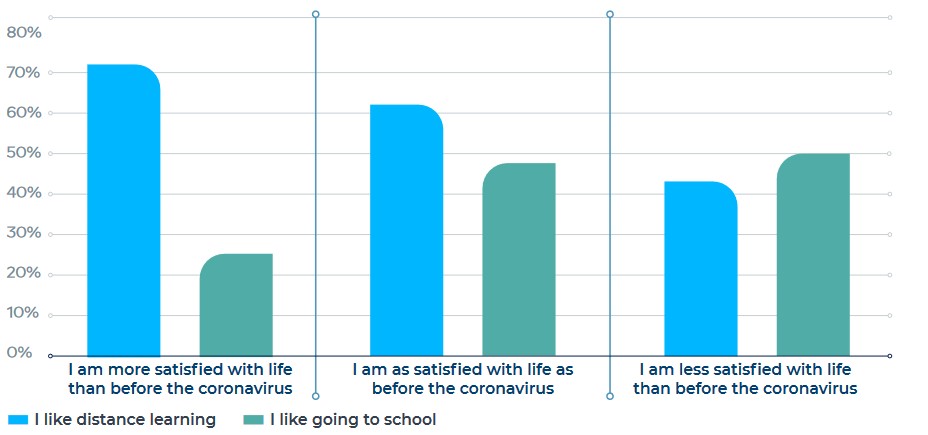
The results of an ISCWeB Supplement Survey conducted during the COVID-19 pandemic5 show that students’ overall satisfaction with life in retrospect fell from an average of 8.4 points to 7.2 points on a 10-point scale during the pandemic period. Life satisfaction decreased more in girls than in boys, and not all children experienced a decline in life satisfaction or did not experience it to the same degree. While slightly more than half (52%) of the children reported that their life satisfaction was lower than it was before the pandemic, 33% of the children perceived no change in their life satisfaction level, and 15% of the children reported an improved satisfaction level.
There was an especially large increase in satisfaction among students who tend to prefer distance learning (Figure 3.3.5).
Comparing the feedback of these groups on home and school, the group whose satisfaction remained the same before and during the pandemic seems to be the most balanced. Despite the restrictions, these students continued to cope well both in everyday activities (playing sports, reading and spending free time outdoors) and in schoolwork. They felt more supported by teachers and perceived greater autonomy at school, especially compared to children whose satisfaction increased during the pandemic. They could see the positive aspects of the pandemic period. For example, they appreciated more than others the fact that they were able to spend more time with their family, sleep longer, and make their own schedule. They also learned new ways to do schoolwork online.
Children whose satisfaction level increased during the pandemic admitted that they had not been particularly satisfied with their relationships, school or teachers’ support before the pandemic. They missed their classmates less and were less likely to want to go back to school, because during the lockdown, they had more free time at home and fewer responsibilities; they played computer games more often, met their friends online, spent less time outdoors and participated in sports less. They also missed the teachers’ guidance less and worried less about getting bad marks at school because of COVID-19. They liked distance learning more than other students did, and almost half said that they never felt like going to school during the pandemic.
Students whose satisfaction decreased during the pandemic worried about their studies and missed their friends. During distance learning, they spent more time doing schoolwork and less time playing, being physically active and socialising with friends. Compared to the other two groups, they missed the teachers’ advice more often and studied more with their parents. They liked distance learning less than face-to-face learning. They were more worried about the changes to their life as a student and that, due to the lockdown, they might get bad marks at school. They also had significantly more other pandemic-related concerns, such as worries about family finances or about family members becoming infected.
Overall, 16% of students felt anxiety due to the pandemic. Girls felt this way more than boys. COVID-19-related anxiety was felt most by otherwise able and coping students, whose anxiety may have been due in part to greater awareness and a general tendency to worry. Compared to less anxious children, they received more information about the virus and felt less safe in general – at home, at school and near the home. They also worried about themselves and family members getting infected and about family finances, marks and other issues related to school.
Data from the national satisfaction survey (whose data were collected in February 2021, before distance learning) show that older students were more affected by the pandemic than younger ones. Eleventh-grade students and adult learners admit to being tense during the COVID-19 crisis significantly more often (42–43% of them often felt tense) than fourth-graders (14%) or eighth-graders (33%).
While young and highly educated people generally have better mental health than older and less educated people, students’ mental health is significantly worse during university studies. The analysis by Käosaar and Purre (2021) explains the mental health situation of university students. The survey data were collected in 2019 within the framework of the international Eurostudent survey, to which an abbreviated Estonian emotional wellbeing questionnaire was added. This was the basis for calculating the emotional distress (hereinafter stress) score (with subscales for depressiveness, anxiety, mental exhaustion and sleep disorders). A total of 2760 students from all Estonian higher education institutions responded to the survey. While 9% of students feel that they have some kind of mental health problem (3% in 2015), a significantly larger proportion of students have a high level of emotional stress.
According to the National Institute for Health Development 2014 health survey, while about 9% of all those of university age experienced a significant level of stress, this indicator was 49% among university students. This seems like an exceptionally high proportion, but similar results have been obtained in previous studies from other countries (Sharp and Teiler 2018). The stress level is higher among female students, students with special needs, Russian-speaking students, students with financial difficulties and students who have experienced bullying at university. Interestingly, the stress level is higher among those bachelor’s degree students who have entered university immediately after completing the previous level of study, as well as those who do not work and do not have children. This result differs from several previous studies (see Sharp and Teiler 2018 for an overview), , in which working and family responsibilities are associated with higher stress in students.
Among school-related factors, a lack of motivation, a lack of communication with fellow students and a lack of clarity regarding the completion of the curriculum predict greater stress. Support from the teaching staff improves wellbeing.
The same phenomenon was analysed using data from the 2021 Estonian national mental health study,6 comparing students and employees aged 20 to 29. The analysis also revealed that students have higher levels of anxiety and depressiveness than working people do. This difference is fully explained by background characteristics, including income and gender. In other words, among students there are more people with financial difficulties and more women with depressiveness. However, differences in general anxiety remain even after matching based on background characteristics. Since it is a cross-sectional study, we cannot definitively assess whether more anxious young people are more likely to study or whether the increase in anxiety stems from the learning environment. However, previous longitudinal studies (e.g. Andrews and Wilding 2004) show an increase in both anxiety and, to a lesser extent, depressiveness during university studies and relate this to student lifestyles. Among the causes of these problems are academic and time pressure, dissatisfaction with studies and lack of support from teaching staff, low self-efficacy and unclear career prospects, as well as financial difficulties. The importance of moderation is reinforced by the fact that those who study very little or very much have more problems (Larcombe et al. 2016). A high level of stress is, in turn, associated with poor academic results, dropping out and risky behaviour (smoking, alcohol and drug use, suicidal thoughts).
Summary
By international comparison, Estonian students’ wellbeing at school is at an average level. According to the PISA study, Estonia is one of the few countries where students’ academic results are outstanding while their life satisfaction is average or above average. A comparison of children of different ages within Estonia shows that eighth-grade students are in a relatively difficult situation. This is probably related to age characteristics, as well as the fact that their relationship with teachers remains more distant than that of fourth-grade students, who mainly have one teacher. By the eighth grade, interest in learning has also decreased significantly. Compared to upper secondary school students, eighth-grade students also have a lower level of perceived autonomy, or the ability to make choices, and poorer relationships with fellow students. They also have poorer self-management skills, which could help solve problems and stay motivated. Students with special needs generally rate their wellbeing lower.
Wellbeing at school depends on good relationships at home and the support of teachers and fellow students. Speaking of relationships, it is crucial to reduce bullying and provide support for students with special needs. In addition to relationships, it is important that the learning environment allows for shaping the learning process autonomously and offers instruction that encourages learning and is related to real life. These three factors – good relationships, choices in learning, and learning that offers real-life tasks and experiences of success – are the three foundations for maintaining and developing students’ interest in learning. Interest in learning, in turn, means both enhanced wellbeing and better academic results.
As to the schools where students are happier, there is no systematic difference in wellbeing between counties or concerning the language of instruction. However, in upper secondary school, the wellbeing of Russian-speaking students is lower, which points to problems in what is known as the ‘60+40 system’ (at least 60% of teaching in upper secondary school must be in Estonian), where students are likely to have coping difficulties and unclear prospects.
Younger students’ wellbeing is higher in smaller schools, and upper secondary school students’ wellbeing is higher in larger schools. This should be taken into account when designing the school network reform. While relationships are crucial at a younger age, the need to make learning-related decisions becomes more important at higher levels of school. wellbeing in education is fostered by students’ participation in extracurricular activities both at school and outside of school. It is important to emphasise the wide spectrum of influence that extracurricular education has on the development of children’s autonomy, self-efficacy and social relatedness, which is why students should have enough choices and access to extracurricular education.
University students’ mental health indicators are of concern, as nearly half of students have high levels of emotional stress. Like school students, university students with special needs and/or economic difficulties experience more stress. Problems are caused or amplified by unclear learning goals, a lack of motivation and a lack of support from the higher education institution and fellow students. Those who perform multiple roles – working students and students with family responsibilities – do surprisingly well. This shows that lifelong learning works – that higher education institutions can offer flexible learning opportunities. But it also shows that greater time pressure is compensated by a better economic situation and clearer learning motivation.
In summary, wellbeing is not just a nice addition to learning, which is the main goal at school. Improving wellbeing is an important task that keeps students functioning and healthy both during school and later in life, and supports their interest in learning. School cannot take away children’s special needs or change the family’s difficult economic situation, but it is these groups that need special support. At the same time, the school holds at least three keys to creating wellbeing: good relationships (including reducing bullying), supporting learners’ autonomy (including offering decisions and choices) and creating an environment that supports an interest in learning.
Andrews, B., & Wilding, J. (2004). The relation of depression and anxiety to life-stress and achievement in students. British Journal of Psychology, 95, 509–521. https://doi.org/10.1348/0007126042369802
Burns, T. & F. Gottschalk (eds.) (2019). Educating 21st Century Children: Emotional Well-being in the Digital Age, Educational Research and Innovation, OECD Publishing, Paris. https://doi.org/10.1787/b7f33425-en.
Choi, A. (2018). Emotional well-being of children and adolescents: Recent trends and relevant factors, OECD Education Working Papers, No. 169, OECD Publishing, Paris. https://dx.doi.org/10.1787/41576fb2-en.
Kieling, C. et al. (2011). Child and adolescent mental health worldwide: Evidence for action, The Lancet Vol. 378/9801, pp. 1515–1525. https://doi.org/10.1016/S0140-6736(11)60827-1.
Kutsar, D., & Kurvet-Käosaar, L. (2021). The Impact of the COVID-19 Pandemic on Families: Young People’s Experiences in Estonia. Frontiers in Sociology, 6 (732984), 1−12. DOI: 10.3389/fsoc.2021.732984.
Käosaar, A., & Purre, M. (2021). Eurostudent VII: fookus Eesti üliõpilaste vaimsel tervisel. TÜ ja TLÜ. https://www.hm.ee/sites/default/files/eurostudent_vii_vaimse_tervise_raport.pdf
Larcombe, W., Finch, S., Sore, R., M. Murray, C., Kentish, S., Mulder, R., Lee-Stecum, P., Baik, C., Tokatlidis O., & Williams, D. (2016). Prevalence and socio-demographic correlates of psychological distress among students at an Australian university. Studies in Higher Education, 41(6), 1074–1091. https://doi.org/10.1080/03075079.2014.966072
Ryan, R. M. & Deci, E. L. (2000). Self-determination theory and the facilitation of intrinsic motivation, social development, and well‐being. American Psychologist, 55, 68‐78.
Sharp, J., & Theiler, S. A (2018). Review of Psychological Distress Among University Students: Pervasiveness, Implications and Potential Points of Intervention. International Journal for the Advancement of Counselling, 40, 193–212. https://doi.org/10.1007/s10447-018-9321-7
Soo, K., & Kutsar, D. (2019). Minu lapsepõlve ‘õnn’ ja ‘õnnetus’ seoses hariduse ja õppimisega: üliõpilaste mälestusi kooliajast. Mäetagused, 74, 99−124. DOI: 10.7592/MT2019.74.soo_kutsar.